Since our launch in 2012, Project NOAH has been at the forefront of disaster prevention and mitigation in the Philippines. With the goal of providing timely, accurate, and actionable information, the platform has empowered communities and local governments to prepare for extreme weather events. Over the years, NOAH has evolved significantly, adapting to new challenges and technologies to continue serving its purpose.
As we enter 2025, this analytics review provides updated insights into NOAH’s performance and reach, highlighting user engagement through Google Analytics and Mapbox Statistics. These tools offer a deeper understanding of NOAH’s impact and how it continues to support disaster risk reduction across the nation.
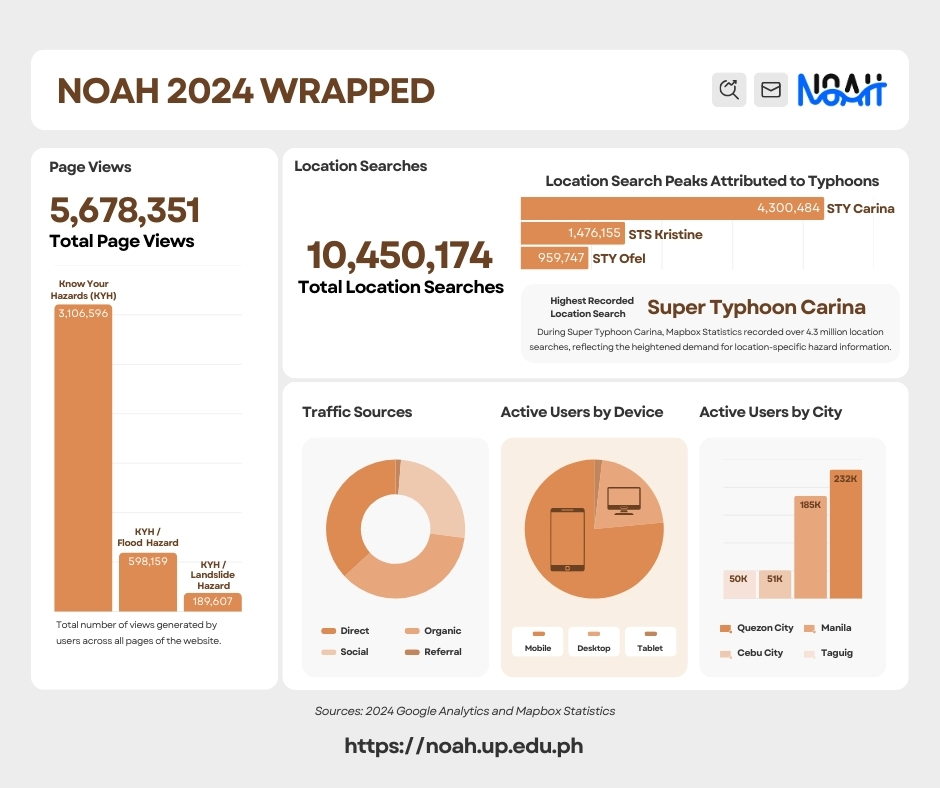
Key Insights Into How Filipinos Use Project NOAH
Since its inception, the NOAH website has been accessed by over 3 million users, with a balanced split of 51.4% new visitors and 49.6% returning users. Last year, the platform has shown sustained growth and responsiveness, particularly during typhoon events.
For 2024, the Google Analytics recorded:
- 1.1 million active users accessed the platform
- 5.1 million page views, with the “Know Your Hazards” feature receiving over 3 million views, underscoring its importance in raising awareness of local exposure to hazards
- 20 million interactions, reflecting the high level of engagement from users exploring local hazard assessment from the “Know Your Hazards” feature
When Do People Use NOAH the Most?
The platform’s usage peaks during typhoons, as people turn to it for guidance on how to prepare and stay safe from the threats of hazards such as floods, landslides, and storm surges. This trend has been observed since the launch of Project NOAH in 2012 and was highlighted in our 2022 blog post, where we noted significant spikes in user activity during major typhoons such as Haiyan (Yolanda) in 2013 and Hagupit (Ruby) in 2014.
The pattern has remained consistent in recent years, demonstrating the platform’s continued relevance and reliability during extreme weather events. In 2024, we recorded similar surges during three typhoon events:
- Typhoon Carina: 623K users.
- Typhoon Kristine: 93K users.
- Typhoon Ofel: 82K users.
Interestingly, the user count for Typhoon Carina surpassed even the recorded peaks during Haiyan (181,811 users) and Hagupit (209,927 users) from previous years. This marks the highest recorded peak in NOAH’s history. The spike in usage during Carina highlights the platform’s relevance but also suggests that more Filipinos are actively using disaster tools to stay informed. These numbers reinforce NOAH’s role as a trusted source of hazard information during critical moments, helping individuals and communities make informed decisions.
What Do Mapbox Statistics Tell Us About NOAH’s Impact?
While Google Analytics has traditionally provided insights into overall website traffic, in 2024 we began leveraging Mapbox Statistics to track specific interactions with NOAH’s mapping tools. This integration offers a deeper understanding of how users engage with location-specific hazard information.
In 2024, Mapbox Statistics recorded:
- Over 10 million location searches show how heavily users rely on NOAH’s mapping features to assess risks in their areas.
- Peaks in searches coincided with typhoon events:
- Typhoon Carina (July 19-29): 4.3 million searches.
- Typhoon Kristine (October 19-29): 1.4 million searches.
- Typhoon Ofel (November 9-16): 959K searches.
The consistent spikes in activity across the years demonstrate that NOAH has become an accessible resource for disaster preparedness. Whether through historical trends in Google Analytics or recent insights from Mapbox Statistics, the data reinforces the importance of ensuring NOAH remains accessible and up-to-date. By continuing to track and analyze usage patterns, we aim to refine the platform and ensure it meets the evolving needs of Filipino communities.
As we observed in our 2022 review and continue to see in 2024, the correlation between typhoon events and platform usage highlights NOAH’s critical role in disaster response and preparedness. With the added depth of Mapbox Statistics, we are better equipped to understand not just how many people rely on NOAH, but also how they use it to protect their families and livelihoods during emergencies.
Want to experience NOAH’s tools firsthand? Explore the platform at https://noah.up.edu.ph. For partnerships and inquiries, contact us at resilience.institute@up.edu.ph.