
By: Ms. Arge Louise Joy Esquivel, EnP and Ms. Rysch Nae Subijano, RPF
Introduction
According to widely adopted global risk frameworks, risk is a function of three components: hazard, exposure, and vulnerability. Vulnerability refers to the propensity of exposed elements—such as populations, assets, and systems—to be adversely affected by hazard events, based on their inherent sensitivity and their capacity to anticipate, cope with, resist, and recover from impacts (Intergovernmental Panel on Climate Change, 2014; United Nations Office for Disaster Risk Reduction, 2017). Vulnerability comprises two key components: sensitivity and adaptive capacity (AC). Sensitivity refers to the degree to which a system or species is affected, either adversely or beneficially, by climate-related stimuli (IPCC, 2022). Adaptive capacity, on the other hand, is the ability of systems, institutions, humans, and other organisms to adjust to potential damage, take advantage of opportunities, and manage the consequences of climate change, including variability and extremes (IPCC, 2022).
Assessing vulnerability, therefore, provides a more nuanced understanding of risk beyond the mere presence of hazards or exposed assets. It enables the identification of underlying conditions that influence how severe impacts are experienced across different sectors and locations. This is particularly important in local planning contexts, where interventions can be designed not only to reduce exposure but also to address structural weaknesses and enhance adaptive capacity. By capturing variations in sensitivity and capacity across exposure units, vulnerability assessment supports more targeted, equitable, and context-specific risk reduction strategies.
How the Assessment Was Conducted
Grounded in indicators from the Climate and Disaster Risk Assessment (CDRA) and Local Climate Change Action Plan (LCCAP) guidelines, the assessment involved the collection of primary and secondary data across multiple exposure units in the municipalities of Batanes (Figure 1). These exposure units included population (POP), lifeline utilities (LLU), urban use areas (UUA), critical point facilities (CPF), and natural resource-based production areas (NRPA).
Data were gathered in two phases, through key informant interviews (KII) and structured data collection from relevant municipal offices. These activities formed part of the CDRA process conducted in 2025, which included a workshop on May 22-23, 2025, followed by peer mentoring sessions on May 26–30, 2025. The KIIs gathered qualitative information on exposure conditions and existing coping mechanisms from key municipal offices.
In parallel, the structured data collection involved the systematic completion of sensitivity and adaptive capacity assessment forms. These forms required respondents to score predefined indicators (e.g., access to services, condition of infrastructure, resource dependency, and institutional capacity) using a standardized criteria to ensure consistency across municipalities.
To improve the robustness of the results, multiple offices were requested to independently accomplish the same assessment forms. Participating offices included: Municipality of Basco (Municipal Agriculture Office (MAO), Municipal Disaster Risk Reduction and Management Office (MDRRMO), Municipal Engineering Office (MEO), Municipal Planning and Development Office (MPDO), and Municipal Social Welfare and Development Office (MSWDO); Municipality of Mahatao (MAO, MDRRMO, Municipal Mayor’s Office – Tourism Office (MMO – Tourism), and MSWDO; Municipality of Ivana (MDRRMO, MEO, MPDO, and MAO); Municipality of Uyugan (MDRRMO, MPDO, and MAO); Municipality of Sabtang (MPDO, MAO, and MEO); and Municipality of Itbayat (MDRRMO, MEO, MPDO, and selected barangay representatives). This approach enabled the triangulation of responses and helped surface differences in perception and interpretation across sectors. Barangay representatives in some local government units (LGUs)_ participated in accomplishing the assessment forms and helped validate data by providing ground-level insights.
The team subsequently validated the results during the online CDRA validation activities conducted in 2026. These happened on 09 March 2026 with the Municipalities of Ivana and Mahatao, 10 March 2026 with the Municipality of Basco, 11 March 2026 with the Municipality of Uyugan, 12 March 2026 with the Municipality of Itbayat, and 23 March 2026 with the Municipality of Sabtang. These validation sessions allowed LGUs to review, refine, and confirm the assessment results.
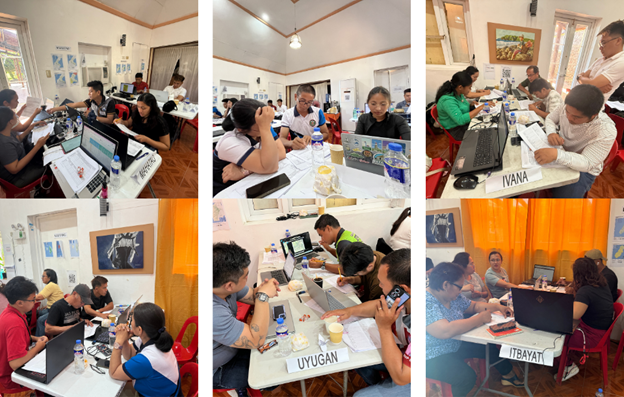
Figure 1. Representatives from the Municipalities of Mahatao (top left), Basco (top middle), Ivana (top right), Sabtang (bottom left), Uyugan (bottom middle), and Itbayat (bottom right) during the activity on creating exposure database
The APN-Batanes project team from the University of the Philippines Resilience Institute (UP RI) supported the processing and analysis of the collected data. Results were synthesized and visualized using radar charts, enabling a comparative view of sensitivity and adaptive capacity across exposure units and municipalities. In these charts, values concentrated near the center indicate very low sensitivity or very high adaptive capacity, whereas more expansive patterns reflect higher sensitivity and lower adaptive capacity.
Key Results by Municipality
The assessment results present the sensitivity, adaptive capacity, and overall vulnerability of each exposure unit—population, urban use areas (UUA), natural resource-based production areas (NRPA), critical point facilities (CPF), and lifeline utilities (LLU)—using a standardized scale ranging from very low to very high. For sensitivity, a score of 5 indicates that the exposure unit has high sensitivity. In contrast, for adaptive capacity, a score of 5 indicates that the exposure unit has low adaptive capacity. These ratings are derived from indicator-based analyses and are used to compare how different exposure units respond to climate-related stressors across municipalities. The following sections discuss the results for each LGU, highlighting key patterns in sensitivity and adaptive capacity and how these translate into overall vulnerability. For synthesis, sensitivity, adaptive capacity, and vulnerability values were averaged across exposure units to derive general ratings for comparison but individual indicator levels may vary depending on context.
Basco
In the Municipality of Basco, population, LLU, UUA, and CPF generally show low sensitivity (Figure 2). In contrast, natural resource-based production NRPA, particularly agricultural and forest lands, record higher sensitivity scores. In terms of adaptive capacity (AC), all exposure units demonstrate a high level of ability to absorb or cope with the impacts of hazards, supported by its highly adaptive technology indicators (Figure 3). Overall, the resulting vulnerability indicates that population, UUA, CPF, and LLU are classified as low vulnerability, whereas NRPA registers moderate vulnerability. This suggests that resource-based sectors are more affected by climate-related stressors than other exposure units.
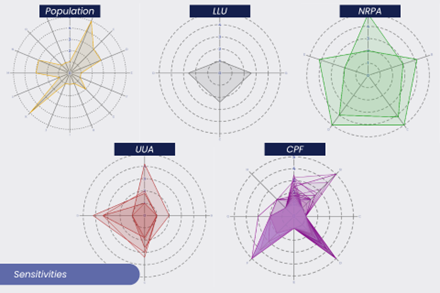
Figure 2. Sensitivities per exposure unit area of the Municipality of Basco
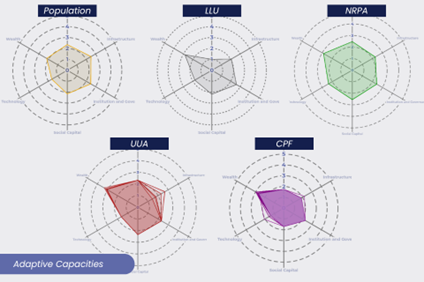
Figure 3. Adaptive capacities per exposure unit area of the Municipality of Basco
Mahatao
For the Municipality of Mahatao, it is observed that sensitivity for population is generally lower due to their low sensitivity to economic indicators (Figure 4). The UUA exposure units are also generally displayed low, mainly due to their low sensitivity to physical indicators. The CPF and LLU have moderate sensitivity, while the NRPA has high sensitivity. In terms of adaptive capacity, all exposure units were assessed as moderate (Figure 5). Overall, the vulnerability is observed to be predominantly moderate across population, LLU, NRPA, and CPF.
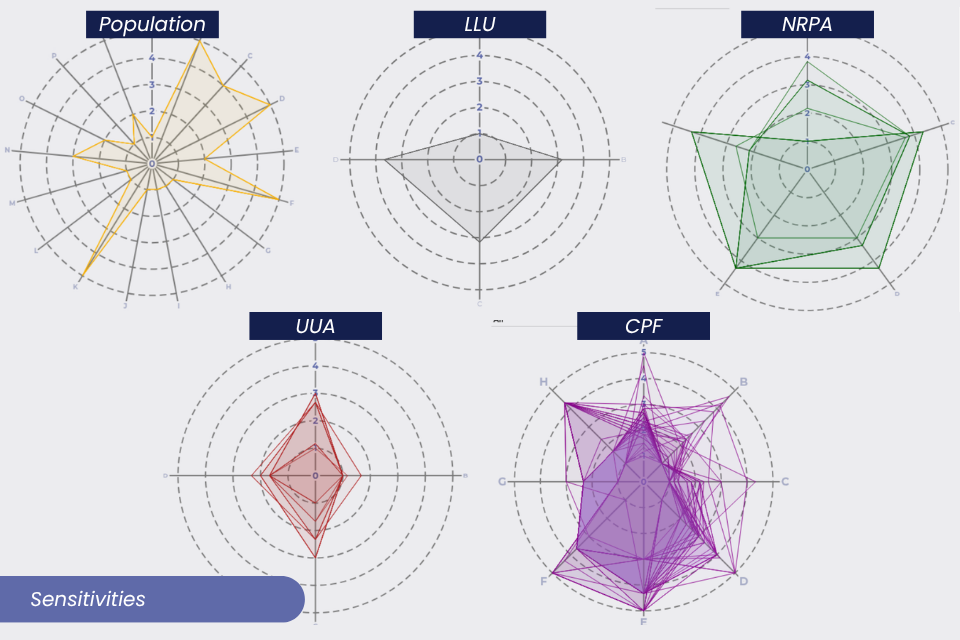
Figure 4. Sensitivities per exposure unit area of the Municipality of Mahatao
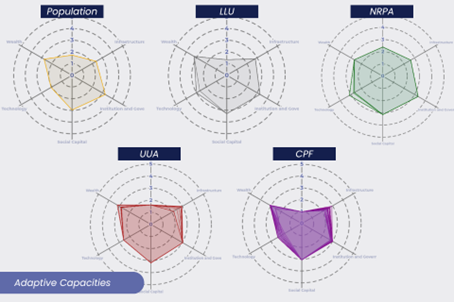
Figure 5. Adaptive capacities per exposure unit area of the Municipality of Mahatao
Ivana
In the Municipality of Ivana, UUA, NRPA, CPF, and LLU, generally exhibit very low sensitivity, while population shows low sensitivity (Figure 6). This indicates that most exposure units are only minimally affected by climate-related stressors. Adaptive capacity is generally high for population, NRPA, UUA, and CPF, and moderate for LLU (Figure 7). mostly experience low vulnerability. Overall, exposure units in Ivana appear less susceptible to climate-related impacts than those in other municipalities.
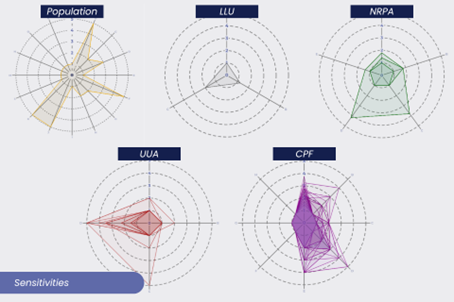
Figure 6. Sensitivities per exposure unit area of the Municipality of Ivana
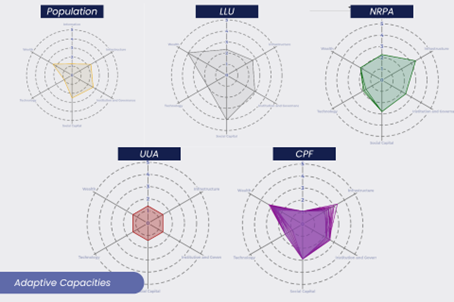
Figure 7. Adaptive capacities per exposure unit area of the Municipality of Ivana
Uyugan
The assessment for the Municipality of Uyugan shows generally low sensitivity across population, UUA, CPF, and LLU. In contrast, NRPA registers high sensitivity (Figure 8). In terms of adaptive capacity, all exposure units exhibit high levels on average (Figure 9). Combining both factors, the overall vulnerability of Uyugan in terms of population, UUA, CPF, and LLU are generally low. Notably, while CPF generally has low vulnerability, some schools, government buildings, and places of worship are moderately vulnerable. In contrast, NRPA, particularly agricultural production, foreshore, and forest lands, consistently register moderate vulnerability due to higher sensitivity scores.
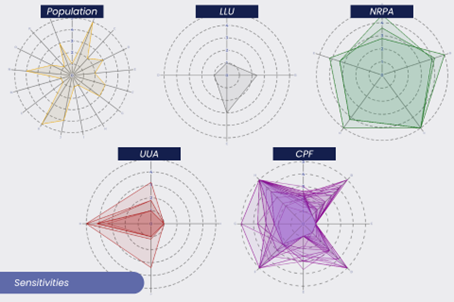
Figure 8. Sensitivities per exposure unit area of the Municipality of Uyugan
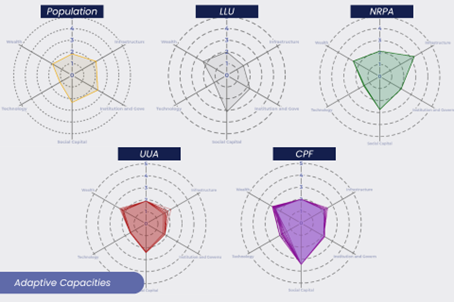
Figure 9. Adaptive capacities per exposure unit area of the Municipality of Uyugan
Sabtang
The CPF diagram in Figure 10 shows the highest concentration at the center, indicating that majority of the critical point facilities (CPF) in the Municipality of Sabtang generally exhibit very low sensitivity. Population and lifeline utilities (LLU) demonstrate low sensitivity, while urban use areas (UUA) register moderate sensitivity (Figure 10). In contrast, natural resource–based production areas (NRPA) display very high sensitivity, indicating a strong response to climate-related stimuli. In terms of adaptive capacity, most exposure units—including population, UUA, CPF, and LLU—are assessed as high, while NRPA records only moderate adaptive capacity (Figure 11). Overall, POP, UUA, and LLU fall under low vulnerability, and CPF generally register very low vulnerability. However, some CPF—such as schools, government buildings, churches, bridges, and piers—show moderate vulnerability, indicating localized infrastructure sensitivity. In contrast, NRPA exhibits high vulnerability, reflecting the combined effects of very high sensitivity and comparatively lower adaptive capacity. In particular, agricultural production and foreshore areas display moderate to high vulnerability, with several locations, including parts of Sumnanga, Malakdang, Savidug, and Sinakan, classified as high.
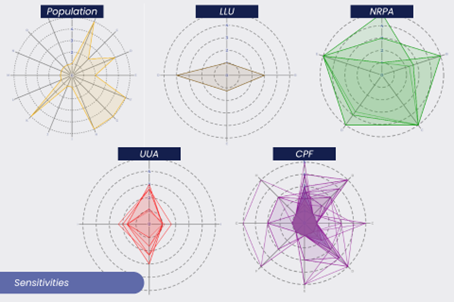
Figure 10. Sensitivities per exposure unit area of the Municipality of Sabtang
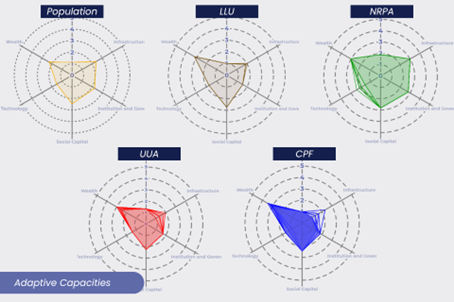
Figure 11. Adaptive capacities per exposure unit area of the Municipality of Sabtang
Itbayat
In the Municipality of Itbayat, UUAs exhibit generally very low sensitivity, while majority of the population, CPF, and LLU show generally low sensitivity. In contrast, NRPA register high sensitivity (Figure 12). In terms of adaptive capacity, POP, UUA, CPF, and LLU are assessed as high, reflecting relatively strong capacity to respond to and manage potential impacts (Figure 13). Meanwhile, NRPA demonstrates only moderate adaptive capacity. Overall, POP, UUA, CPF, and LLU fall under low vulnerability, consistent with their low sensitivity and high adaptive capacity. Meanwhile, NRPA exhibits moderate vulnerability, driven by its high sensitivity and comparatively lower adaptive capacity. These results indicate that while most exposure units in Itbayat are relatively resilient, resource-based production areas remain more susceptible to climate-related impacts.
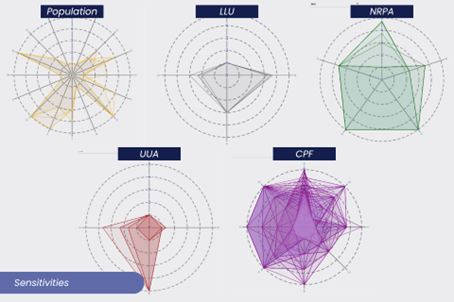
Figure 12. Sensitivities per exposure unit area of the Municipality of Itbayat
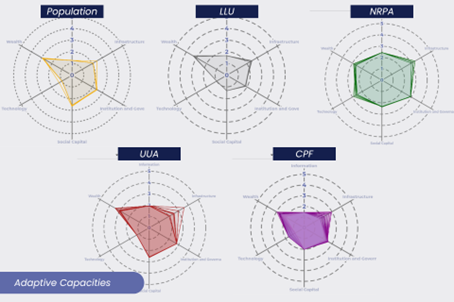
Figure 13. Adaptive capacities per exposure unit area of the Municipality of Itbayat
What Results Mean for Local Planning
The assessment highlights a consistent pattern across municipalities: natural resource-based production areas are generally more vulnerable than other exposure units. This underscores the need to prioritize climate-resilient strategies in agriculture, fisheries, and forest management, particularly given their importance to local livelihoods and food security.
At the same time, the generally low vulnerability observed in population, urban use areas, and many critical facilities suggests that existing adaptive capacities—such as governance systems, infrastructure, and social networks—provide a degree of resilience. However, the presence of moderately vulnerable facilities across municipalities indicates that targeted investments are still necessary to strengthen critical infrastructure.
More importantly, the variability in vulnerability across exposure units and locations demonstrates that a one-size-fits-all approach to planning is insufficient. Instead, local governments should adopt differentiated strategies that address the specific drivers of sensitivity and capacity in each sector.
Moving Forward
Moving forward, the results of this vulnerability assessment can inform the prioritization of interventions under the Comprehensive Land Use Plan (CLUP), Comprehensive Development Plan (CDP), Local Climate Change Action Plan (LCCAP), Local Disaster Risk and Reduction Management Plan (LDRRMP), and other local plans.
Efforts should focus on reducing sensitivity in highly vulnerable sectors—particularly NRPA—through measures such as climate-resilient agricultural practices, ecosystem-based management, and diversification of livelihoods. At the same time, strengthening adaptive capacity across all exposure units remains critical, including improving access to early warning systems, enhancing institutional coordination, and investing in resilient infrastructure.
Regular updating of vulnerability assessments is also recommended to capture changing conditions and improve the evidence base for decision-making. By integrating these results into planning processes, municipalities in Batanes can move toward more proactive, risk-informed, and resilience-oriented development pathways.
Beyond the quantitative results and their implications for planning, the process of conducting the assessment also generated several insights from the perspective of practice.
Reflection
Conducting the vulnerability assessment in different municipalities of Batanes gave us new insights on how vulnerability is understood, not just as a measurable component of risk, but also as a context-dependent condition. While the framework provided clear parameters through sensitivity and adaptive capacity indicators, the process of data collection revealed that vulnerability is often interpreted differently across institutions, shaped by sectoral priorities, experiences, and available information.
One key realization is that vulnerability is not always immediately visible in quantitative results. In several instances, areas classified as having “low vulnerability” still exhibited underlying concerns when discussed with local offices, particularly in relation to resource dependence and service continuity during extreme events. This suggests that while indicators are essential for standardization, they may not fully capture the nuances of local realities without being complemented by qualitative insights.
The triangulation approach—having multiple offices respond to the same assessment tool—also revealed institutional dynamics that influence how risk is framed. Differences in responses highlighted that vulnerability is not only a condition of exposed systems but also a function of how knowledge is produced, shared, and interpreted within local governments. This underscores the importance of participatory and iterative processes in vulnerability assessment, rather than relying solely on one-time technical exercises.
Finally, this assessment underscored that vulnerability is dynamic. The results represent conditions at a given point in time, but these are subject to change as socio-economic conditions evolve, infrastructure improves, or climate hazards intensify. As such, vulnerability assessment should be viewed not as an endpoint, but as part of a continuous process of learning and adaptation.
These reflections suggest that strengthening resilience in Batanes—and in similar contexts—requires going beyond technical assessment toward deeper engagement with local knowledge systems, institutional practices, and the interdependencies between human and natural systems.