Written by: Ms. Marie Claire P. Mandar, EnP. and Ms. Ella Danielle C. Santiaguel, EnP.
Introduction
Assessing climate and disaster risk is a critical step in understanding how hazards may affect communities, particularly in geographically exposed areas such as Batanes. In widely used frameworks, risk is defined as the potential for adverse consequences to a system resulting from the interaction of hazard, exposure, and vulnerability (Intergovernmental Panel on Climate Change (IPCC), 2014; United Nations Office for Disaster Risk Reduction (UNDRR), 2017; Figure 1).
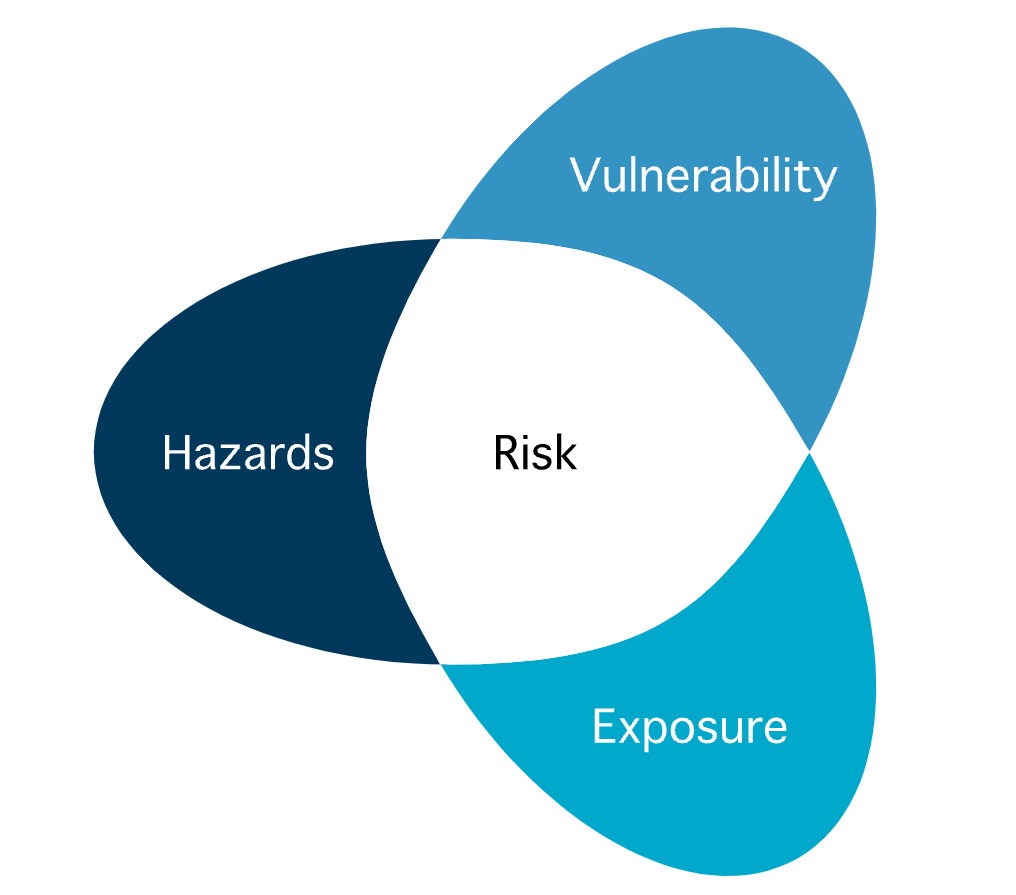
Figure 1. IPCC Fifth Assessment Report (AR5) Risk Framework.
Each of these components captures a different dimension of potential impact. Hazards refer to the potential occurrence of natural or human-induced physical events or processes that may cause adverse impacts such as flooding, storm surge and rain-induced. Exposure describes the presence of people, infrastructure, livelihoods, and ecosystems in areas that may be affected by these hazards (IPCC, 2014). Vulnerability, on the other hand, refers to the state or conditions influenced by the social, economic, physical and environmental factors or processes that increase or decrease the susceptibility or likelihood of a system to experience the adverse impacts of hazards (UNDRR, 2016).
Building on the socio-economic and geographic context of Batanes, the need for a robust and systematic risk assessment becomes particularly evident. The municipalities of the province, classified as 5th- to 6th-class with relatively low competitiveness levels (Department of Trade and Industry (DTI), 2023), are situated within the Philippines—widely recognized as among the most disaster-prone countries globally (Bündnis Entwicklung Hilft and IFHV, 2023). For small island local government units (LGUs) with limited land, resources, and redundancy in infrastructure systems, overlapping hazards can produce compounded risks that are more difficult to anticipate and manage.
Despite these constraints, the long-standing adaptive practices of Ivatan communities, rooted in generations of indigenous knowledge and social systems, demonstrate an inherent capacity to cope with environmental stressors (Board, 2019; Shaw et al., 2008). However, while these traditional strategies remain valuable, the increasing intensity and uncertainty associated with climate-related hazards necessitate more systematic and forward-looking approaches to risk analysis.
In this context, risk assessment serves as a critical mechanism for translating these complex conditions into actionable insights for planning. Rather than treating hazards, exposure, and vulnerability as isolated datasets, this process integrates them to identify where and how impacts are most likely to occur. For LGUs like Batanes, this enables more strategic decision-making, such as prioritizing high-risk areas for intervention, guiding land use allocation, and informing the design and siting of infrastructure. Risk assessment operationalizes available data into evidence-based inputs for development planning, supporting a shift from reactive responses toward anticipatory, risk-informed, and context-sensitive governance.
Climate and Disaster Risk Assessment Methodology
In the Philippines, the Department of Human Settlements and Urban Development developed a Climate and Disaster Risk Assessment (CDRA) Tool to guide the systematic evaluation of vulnerabilities and risks from natural hazards and climate change, supporting risk-sensitive land use planning while integrating both scientific and indigenous knowledge.
Aligned with this framework, the project adopted a learning-by-doing approach structured into three phases: Learn, Do, and Reflect, ensuring a participatory and iterative process with partner LGUs. During the Learn phase, partnerships were established, and capacity-building activities, including a Geographic Information Systems (GIS) workshop, enabled the development of a baseline exposure database covering population, infrastructure, lifelines, and other at-risk elements. Foundational concepts, policies, and data collection methods were also introduced to prepare LGUs for the assessment.
The Do phase implemented the risk assessment by integrating probabilistic hazard data, multi-scenario climate projections, exposure datasets, and vulnerability indicators. Following the IPCC framework, risk was assessed as the interaction of hazard, exposure, and vulnerability. The hazard component considered both likelihood (based on return periods) and magnitude, which were combined to represent the overall severity and frequency of hazard events.
The exposure component represents the extent to which elements at risk, such as population, infrastructure, and critical facilities, are located within hazard-prone areas. This was measured based on the proportion or percentage of exposed areas or assets, using classification ranges adapted from the National Disaster Risk Reduction and Management Council (NDRRMC) Memorandum Order No. 60 on the Declaration of State of Calamity Guidelines. Higher exposure scores indicate a greater concentration of people and assets in areas susceptible to hazards.
The vulnerability component reflects the susceptibility of exposed elements to damage, taking into account both their inherent characteristics and their capacity to cope with and recover from impacts. This was derived from two sub-components: sensitivity, which indicates how severely elements may be affected, and adaptive capacity, which captures the ability of systems and communities to respond to and recover from hazard events. These were combined to produce an overall vulnerability score.
These three components were then integrated to generate a composite risk index, representing the potential severity of impacts under specific hazard conditions. This risk scoring and indexing approach provides a systematic and transparent means of translating complex, multi-dimensional datasets into interpretable and comparable metrics, supporting spatial analysis, prioritization, and risk-informed planning.
Throughout this phase, GIS served as the primary analytical platform, enabling the integration of hazard, exposure, and vulnerability layers to produce spatially explicit risk maps. These maps illustrate the distribution and intensity of risk, supporting the identification of high-risk areas and critical assets requiring intervention. Importantly, the process incorporated participatory validation with LGUs and stakeholders, ensuring that results were grounded in local knowledge and reflective of on-the-ground conditions.
Key Risk Assessment Results by Municipality
This section presents the risk assessment results for each municipality in Batanes, focusing on one representative exposure unit per LGU to illustrate how different hazards affect a specific system. Each selected exposure unit such as population, urban use areas (UUA), critical point facilities (CPF), lifeline utilities (LLU), or natural resource-based production areas (NRPA), captures the effects of various hazards including flooding, landslides, and storm surge.
The risk summaries are based on a multi-scenario, probabilistic assessment, which considers baseline conditions alongside future climate scenarios (Representative Concentration Pathway (RCP) 4.5 and RCP 8.5) across different time horizons (2039, 2065, and 2099). Each table presents the distribution of exposure units across risk levels, ranging from Very Low to Very High, for each hazard type. The numerical values indicate the number of exposed elements to a given level of risk, while the color gradient provides a visual guide, with warmer colors (yellow to red) representing higher risk and cooler colors (green) indicating lower risk. Columns labeled 5-, 25-, and 100-year correspond to hazard return periods, reflecting the likelihood and intensity of hazard events.
Municipality of Basco
As the most populous municipality among the six in Batanes, Basco exhibits a relatively higher concentration of exposed population, making it a critical focus for risk analysis (Figure 2). For flood hazards, the results show a consistent distribution of the population across moderate and high risk categories, with no exposure to very high risk across all scenarios. A larger share of the population falls under moderate risk, particularly at higher return periods (25- and 100-year events), while high-risk exposure is more evident under lower return periods (5-year events). This indicates that more frequent flooding events pose a recurring risk to population centers, although the overall distribution of risk remains largely unchanged across future climate scenarios. The persistence of this pattern suggests a stable but ongoing flood risk, with no significant escalation in severity over time. Similarly, landslide risk is predominantly concentrated in the low to moderate categories, with most population units consistently classified under low risk and only isolated instances reaching moderate or high risk. This reflects a localized and relatively limited impact of landslides on populated areas, with patterns remaining largely stable across scenarios.
In contrast, storm surge risk demonstrates a more nuanced pattern. Under current shoreline conditions, the majority of the population is consistently classified under no risk, with only a small number falling under low to very low risk categories. However, when sea level rise is incorporated, there is a noticeable shift, with some population units moving into moderate and low risk categories across different return periods. While no areas reach high or very high risk, this transition suggests an increasing influence of coastal hazards under future conditions, even if the overall level of risk remains moderate. Overall, Basco’s population risk remains moderate and hazard-dependent, characterized by persistent flood exposure, localized landslide impacts, and a gradual increase in storm surge risk under climate change. These findings highlight the importance of sustained flood management efforts, alongside proactive coastal planning and adaptation measures to address emerging risks.
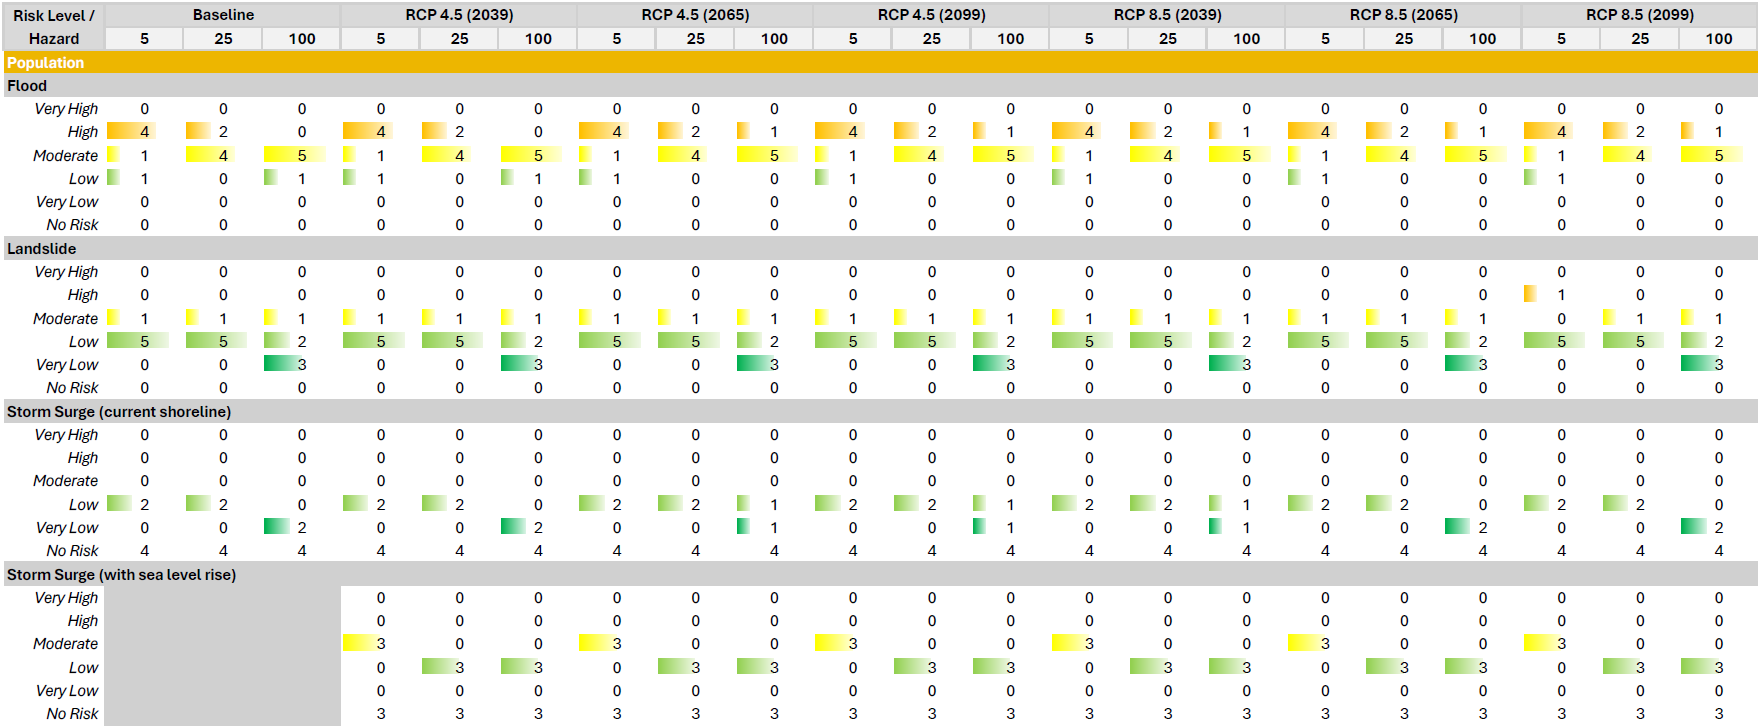
Figure 2. Summary of risk assessment results for the population areas in the Municipality of Basco.
Map 1 shows the flood risk map of the population exposure unit in the Municipality of Basco.
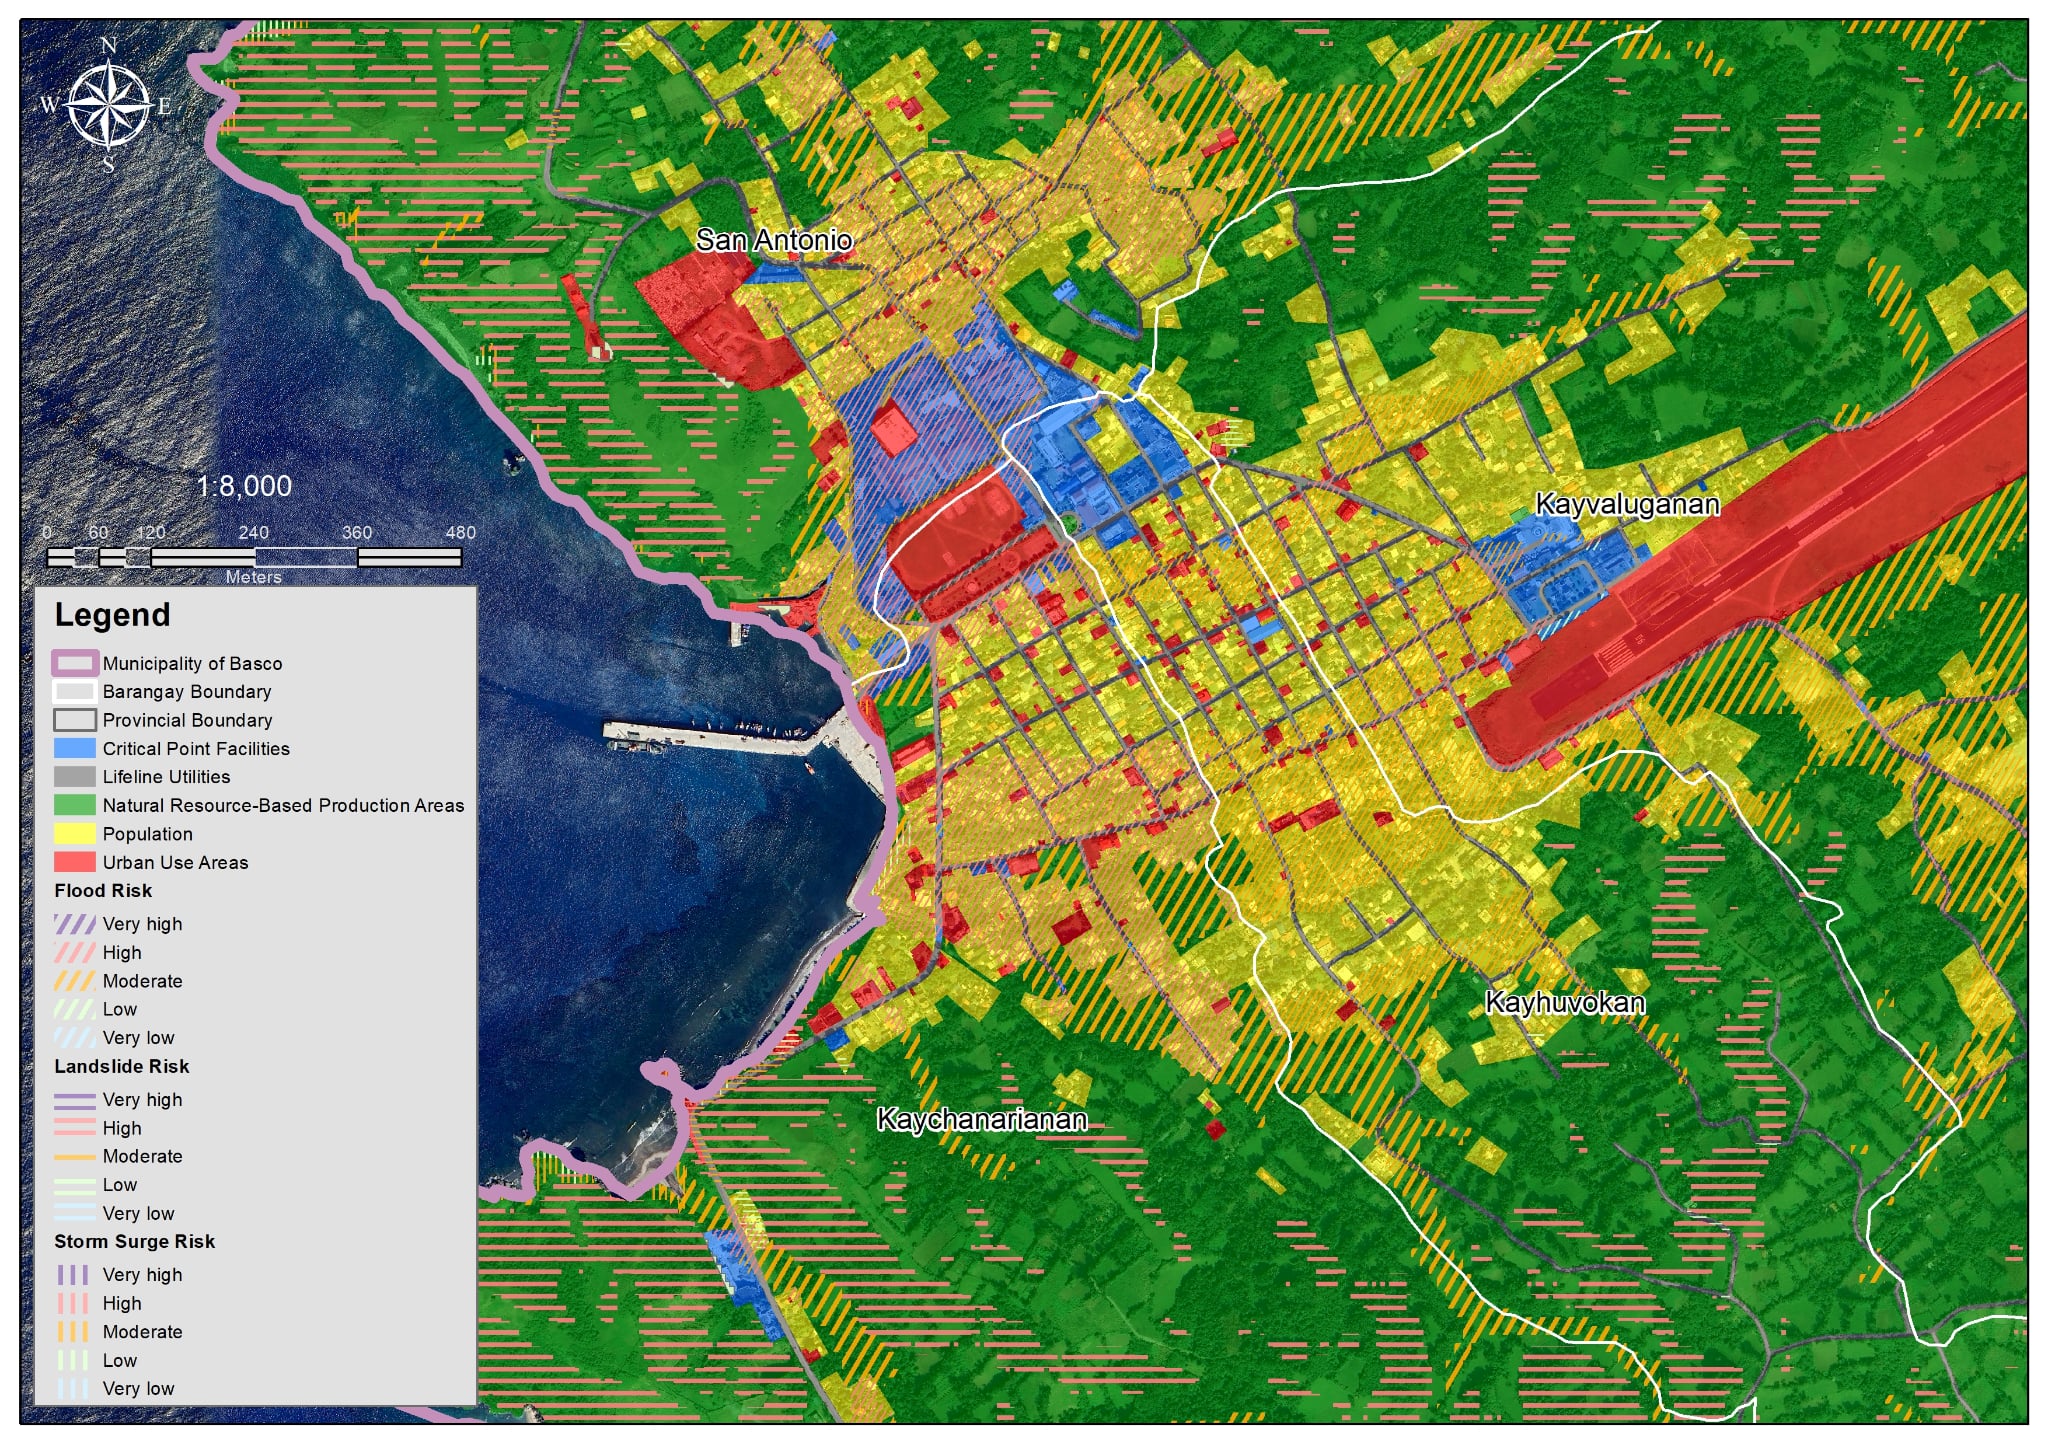
Map 1. Multi-hazard risk map of the población area in the Municipality of Basco, Batanes
Municipality of Itbayat
The assessment of UUAs in Itbayat indicates a risk profile that is largely low to high, with variations across hazard types and return periods (Figure 3). As these areas represent the municipality’s built-up zones—including key community spaces such as the municipal plaza, which serves as a central venue for local events and tourism activities—the results show that flood hazards are the primary driver of risk. A significant portion of urban areas consistently falls under the high-risk category, particularly across 25- and 100-year return periods, while moderate- and low-risk areas remain present but less dominant. Notably, a substantial number of areas are still classified under no risk, indicating uneven exposure across settlements. This pattern suggests that flooding poses a recurring but spatially concentrated risk, affecting specific zones within the urban fabric rather than the entire built-up area.
In comparison, landslide risk is more varied, with areas distributed across low to high risk levels and occasional instances of very high risk under lower return periods. While many areas remain under no risk, areas with higher-risk levels are associated with elevated and cliff-side locations, including tourism areas such as Rapang Cliff.
In contrast, storm surge risk remains negligible across both current and projected conditions. Under present shoreline scenarios, all urban areas are consistently classified under no risk, indicating no direct exposure to coastal inundation. Even with the inclusion of sea level rise, only a minimal number of areas shift into low to very low risk categories, while the overwhelming majority remain unaffected. Notably, low-risk exposure is observed under the 5-year return period but decreases to very low levels under 25- and 100-year events across scenarios. Overall, the risk profile of Itbayat’s urban areas is dominated by flood hazards, with landslides contributing localized but significant risks in elevated areas, and storm surge having minimal influence. These findings highlight the importance of targeted flood risk management in high-exposure zones, alongside site-specific interventions for landslide-prone tourism and settlement areas.
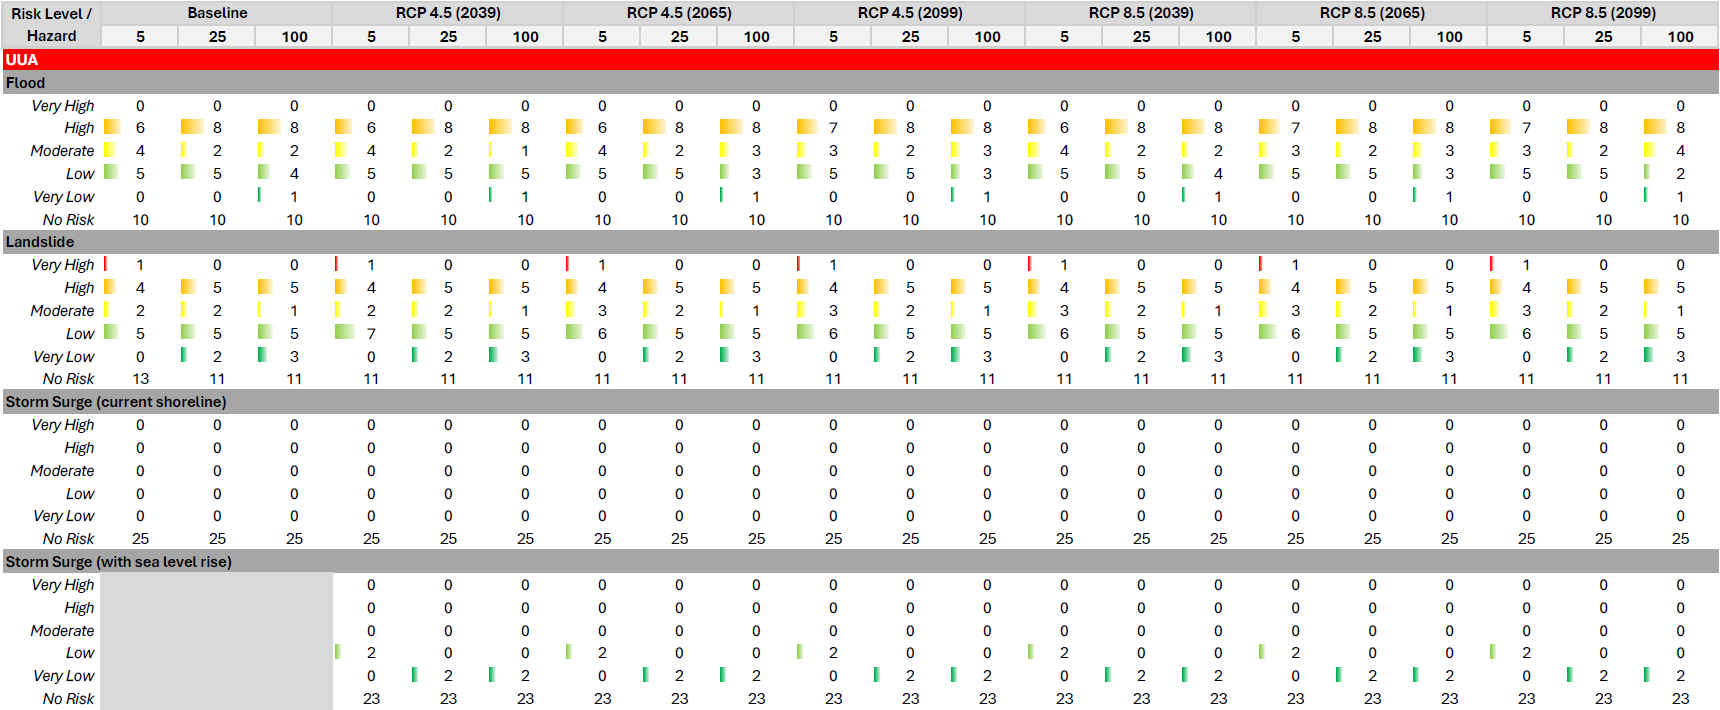
Figure 3. Summary of risk assessment results for the urban use areas in the Municipality of Itbayat.
Map 2 shows the flood risk map of the population exposure unit in the Municipality of Ibayat.
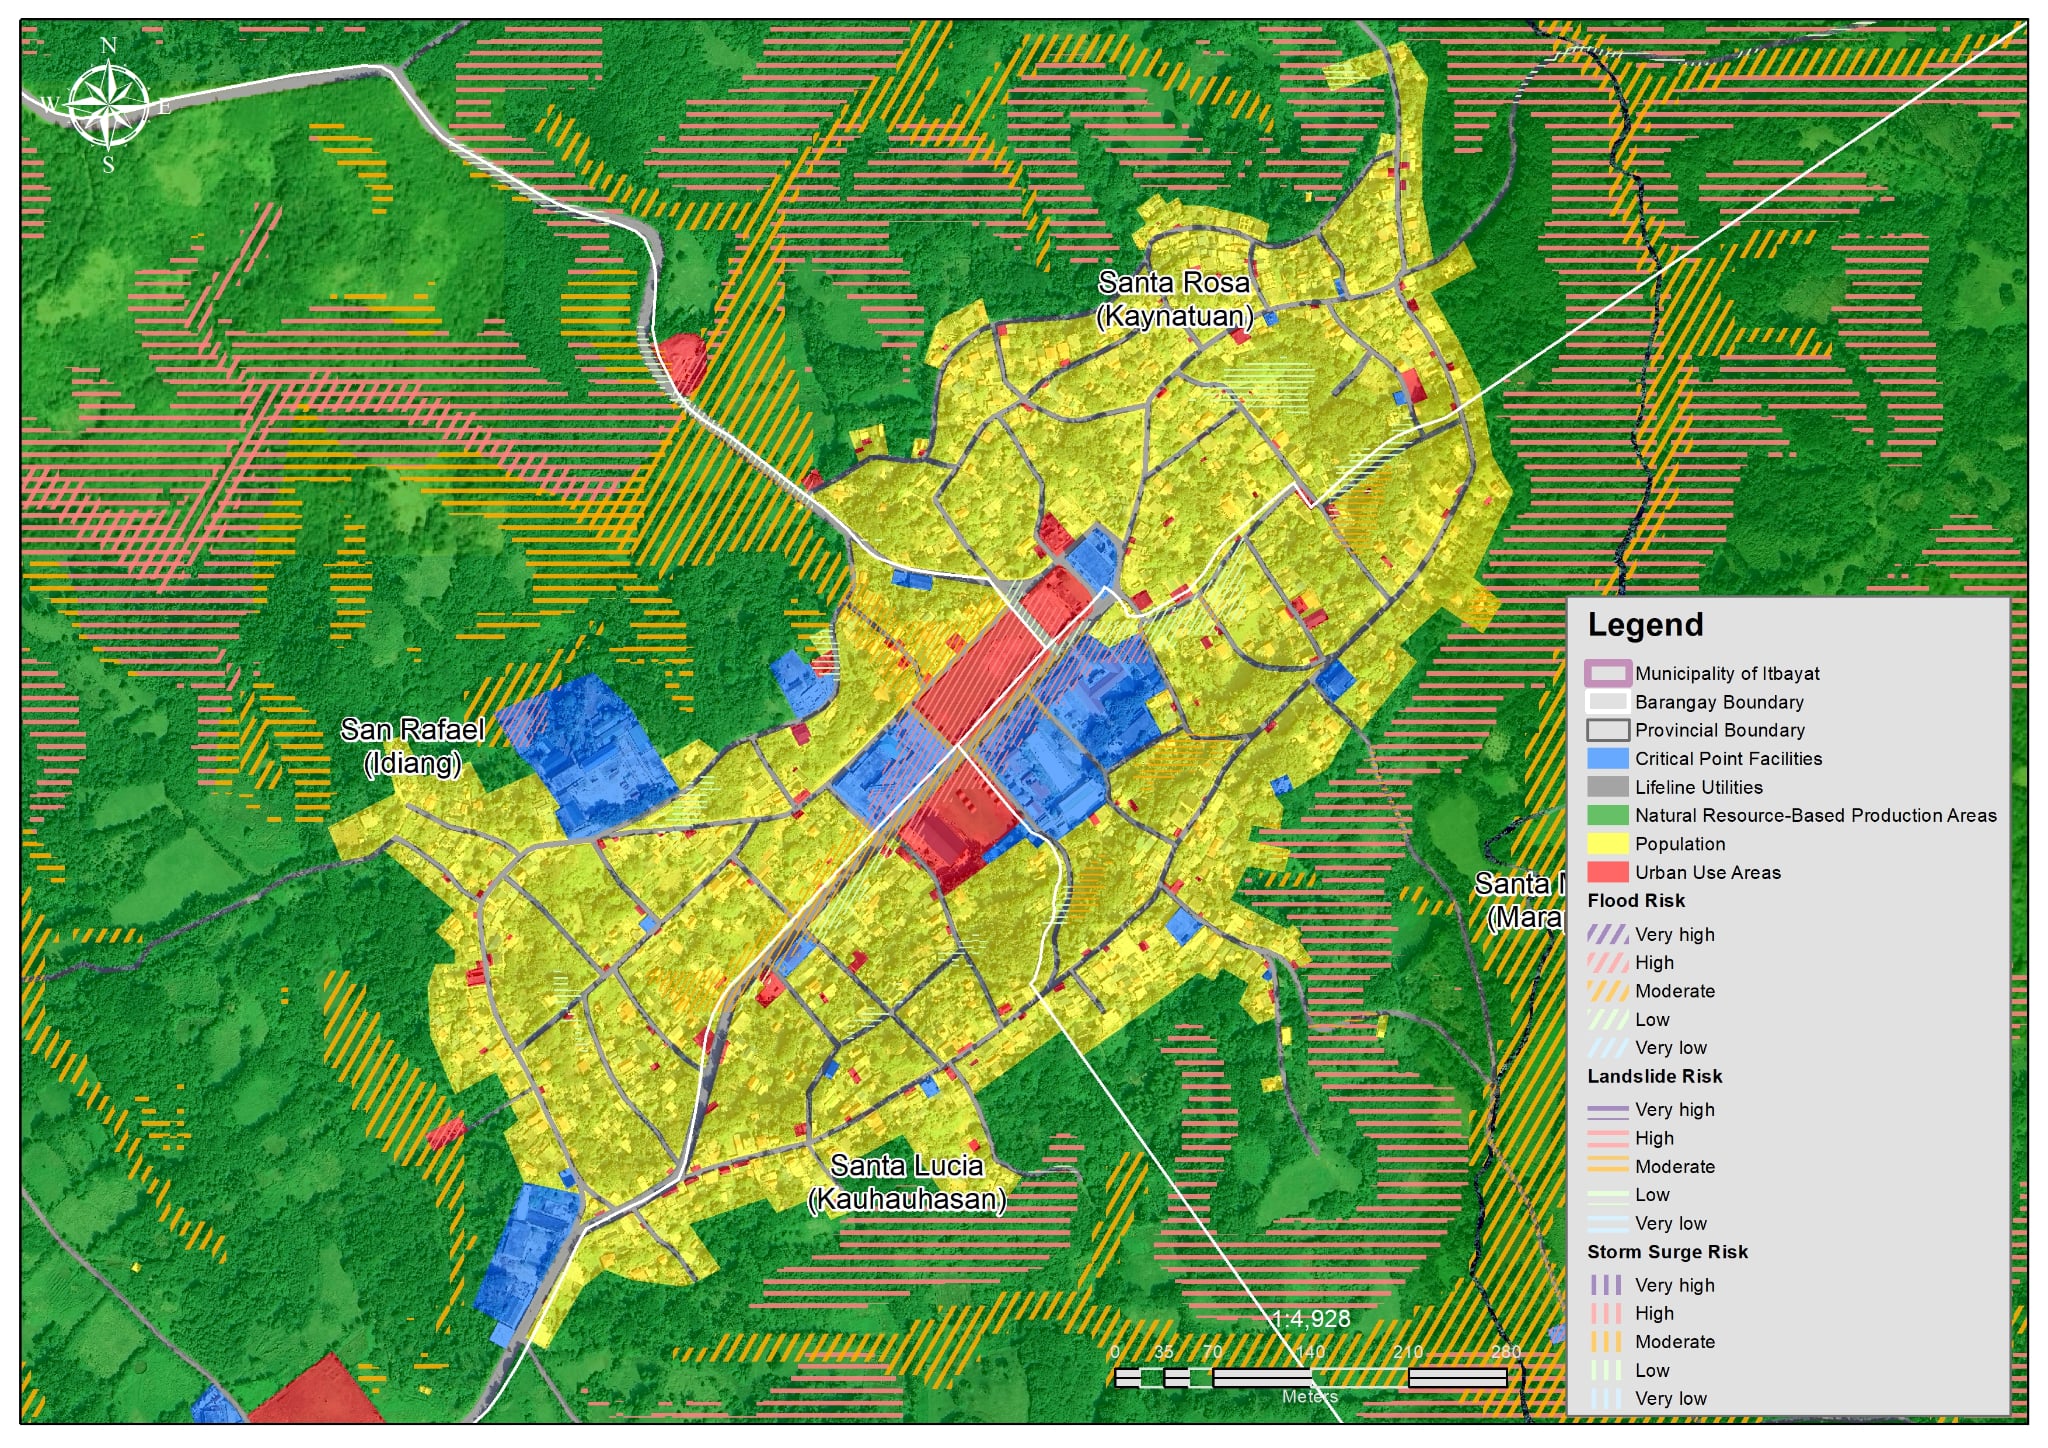 Map 2. Multi-hazard risk map of the población area in the Municipality of Itbayat, Batanes.
Municipality of Mahatao
Risk to critical point facilities (CPFs) in Mahatao shows a mixed but generally moderate-to-high risk profile (Figure 4). While a substantial number of facilities remain classified under no risk across all scenarios, a significant share is consistently exposed to high-risk levels, particularly for both flood and landslide hazards. For flooding, many facilities fall under the high-risk category across all return periods, with several reaching very high risk under the 5-year return period across all scenarios. These include key facilities concentrated in Uvoy, such as the Spanish Bridge/Natividad Bridge, Mahatao Municipal Building, Uvoy Barangay Hall, Mahatao Rural Health Unit and Birthing Home, and the Chawayan Tank. The clustering of these facilities indicates recurrent exposure to flooding in specific low-lying or drainage-constrained areas, affecting critical infrastructure related to governance, transport, health, and water supply. Moderate and low-risk categories are present but less dominant, suggesting that flood risk is spatially concentrated but significant.
A similar trend is observed for landslide hazards, where a large number of CPFs are also classified under high risk, with several facilities reaching very high risk under the 5-year return period across all scenarios. These include the Mahatao Shelter Port in Hañib, the Water Tank in Kaumbakan, the Iraya Water Tank in Panatayan, and multiple facilities in Barangay Uvoy, including the Municipal Building, Rural Health Unit and Birthing Home, and the Jachipuhu Tank. The persistence of very high risk across scenarios indicates structural exposure linked to terrain conditions, particularly for facilities located in elevated or slope-prone areas. This highlights that landslide hazards pose a significant and recurring threat to critical infrastructure, with potential implications for service continuity. In contrast, storm surge under current shoreline conditions has minimal impact, with the majority of facilities consistently classified under no risk, and only a few falling under low to moderate categories. However, when sea level rise is incorporated, a clearer shift emerges, with several facilities moving into high and moderate risk categories, and some reaching very high risk under the 5-year return period. While most facilities remain outside coastal risk zones, this indicates emerging localized vulnerabilities under future conditions. Overall, Mahatao’s CPF risk profile is hazard-dependent, with significant exposure to flood and landslide hazards and increasing sensitivity to coastal processes under climate change, underscoring the need for targeted risk reduction measures, site-specific mitigation, and strengthened resilience of critical facilities.
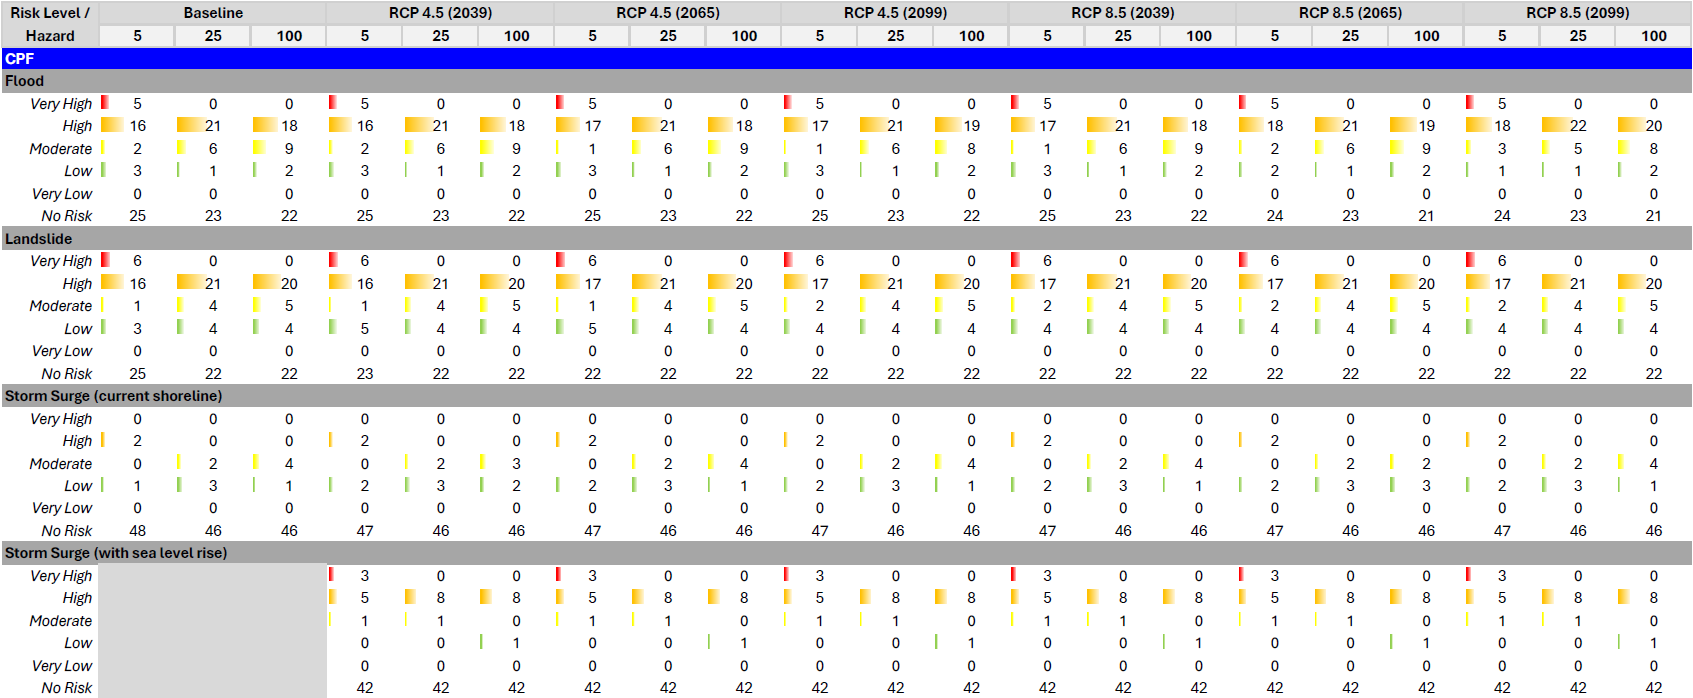
Figure 4. Summary of risk assessment results of the critical point facilities in the Municipality of Mahatao.
Map 3 shows the flood risk map of the population exposure unit in the Municipality of Mahatao.
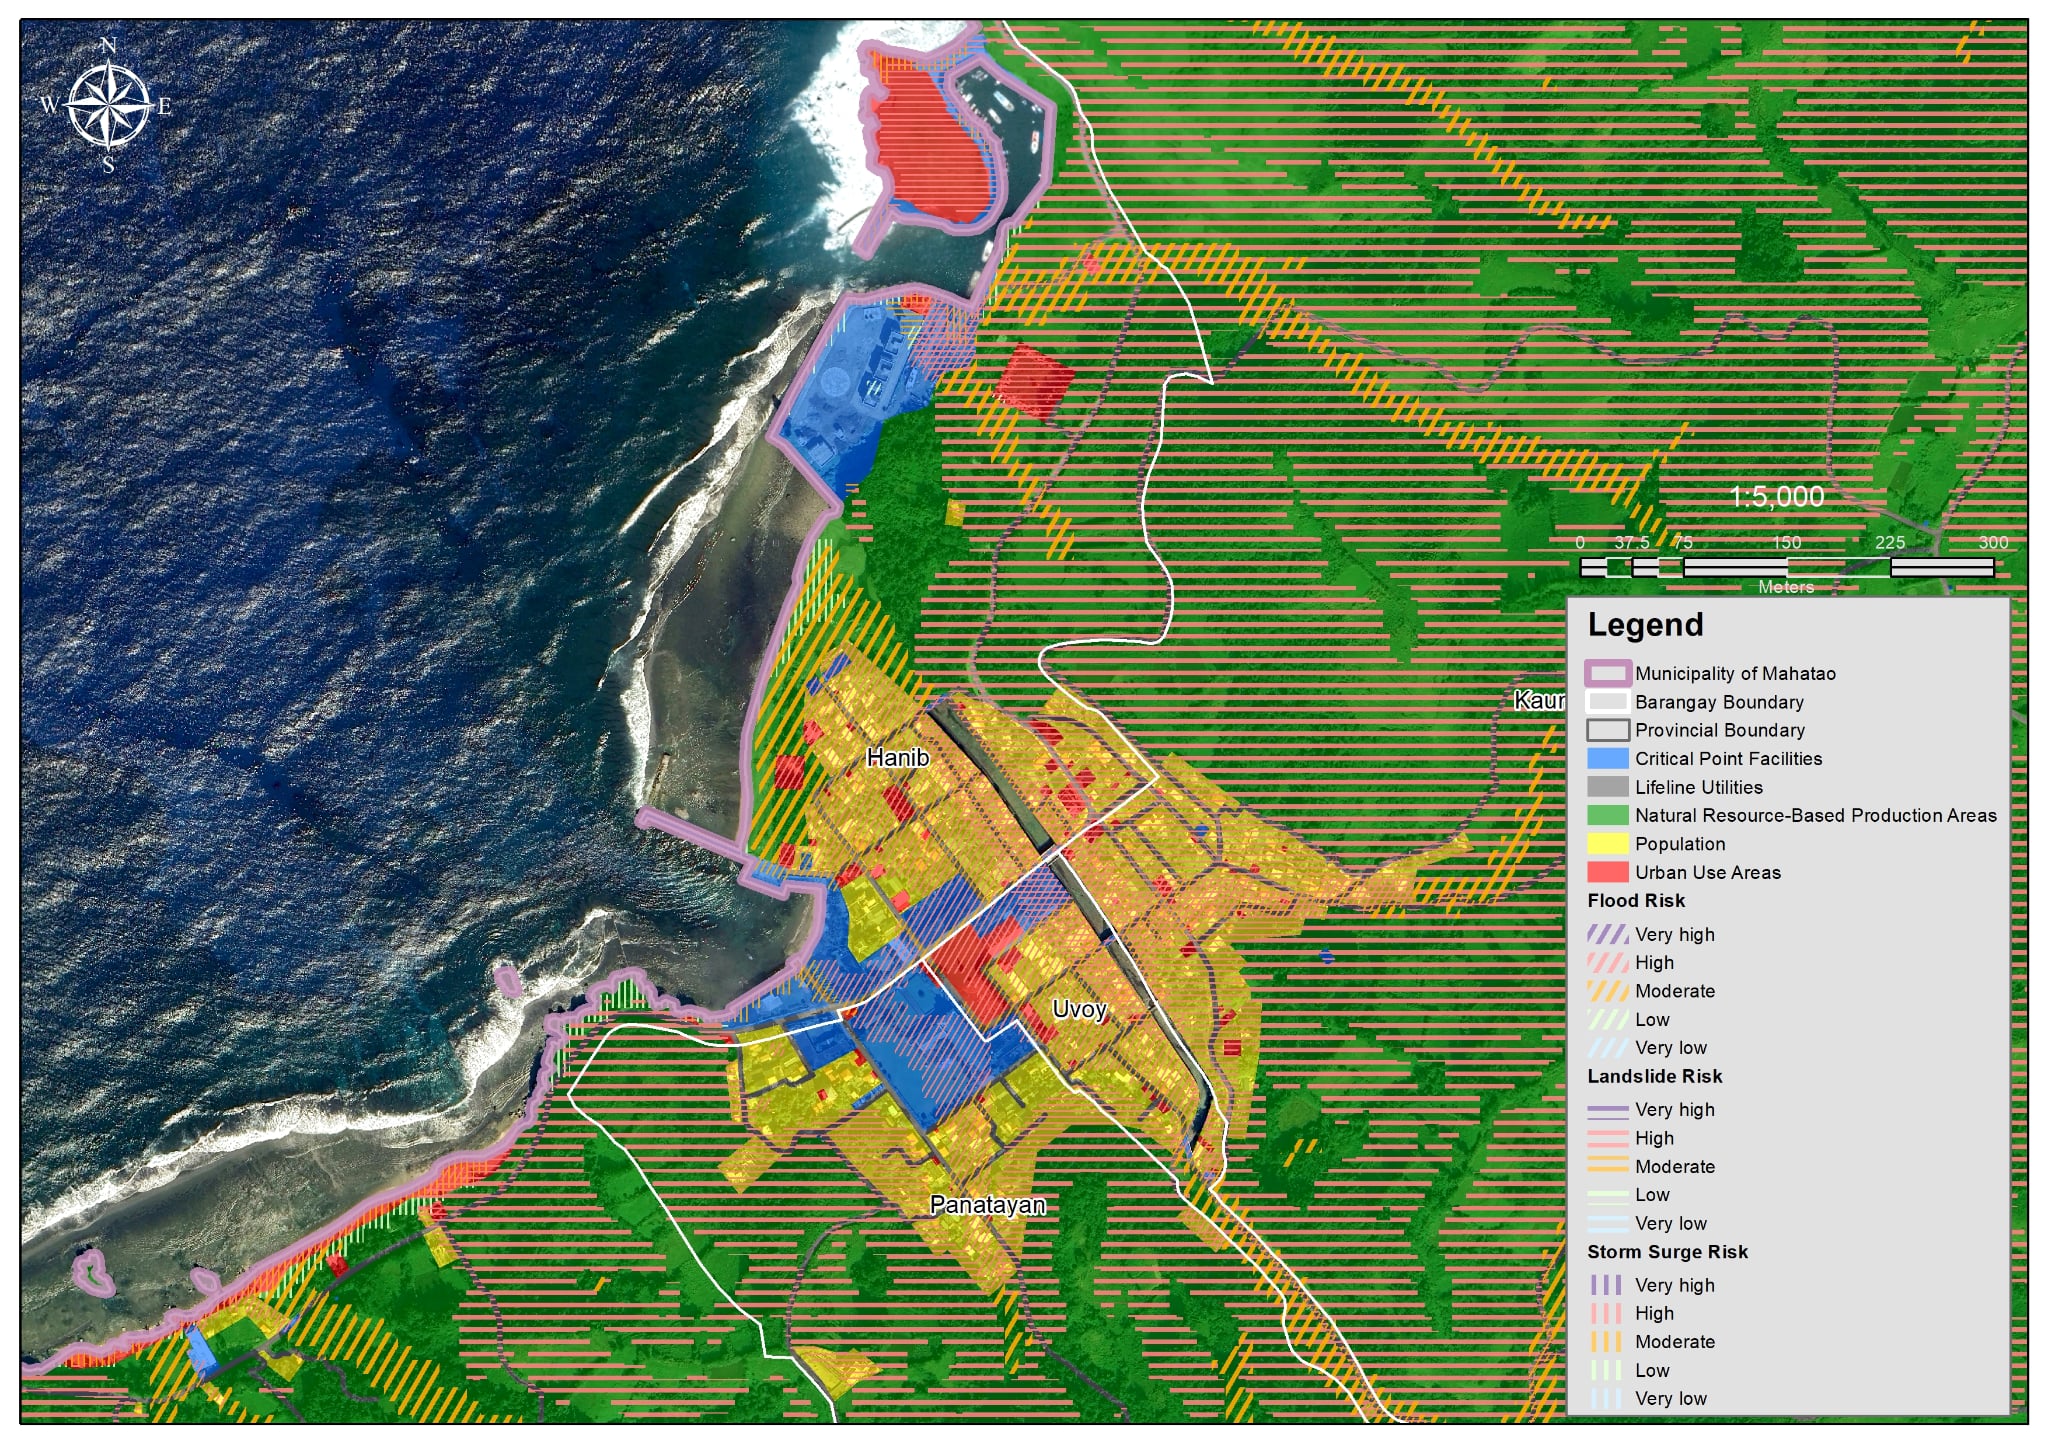
Map 3. Multi-hazard risk map of the población area in the Municipality of Mahatao, Batanes.
Municipality of Uyugan
For the Municipality of Uyugan, the assessment of CPFs highlight their strategic importance, as these include essential assets such as government buildings, health facilities, and emergency services. The results indicate that risk is largely influenced by flood and landslide hazards, with a notable concentration of facilities falling under higher risk categories (Figure 5). Flood risk is predominantly classified as high, with the majority of CPFs consistently falling under this category across all return periods and climate scenarios, alongside a small number of facilities exposed to very high risk, others under lower risk levels, and a notable share classified as no risk. Landslide risk indicates that most CPFs fall under no risk, although among exposed facilities, classifications are largely concentrated in the high-risk category, with some instances of very high risk. Meanwhile, both storm surge under current conditions and with projected sea level rise consistently register no risk across all CPFs, indicating no exposure of these facilities to storm surge hazards.
Across future climate scenarios, flood and landslide risks remain largely consistent in their distribution, with very high-risk classifications evident in the 5-year return period with a notable increase at the RCP 8.5 (2099) scenario. In contrast, storm surge—both under current shoreline conditions and with sea level rise—consistently shows no risk across all CPFs, indicating that these facilities are not exposed to storm surge hazards. Overall, the results highlight a hazard-specific risk profile, where flood and landslide hazards dominate the risk landscape of Uyugan’s critical point facilities, while storm surge does not contribute to the risk profile across all scenarios.
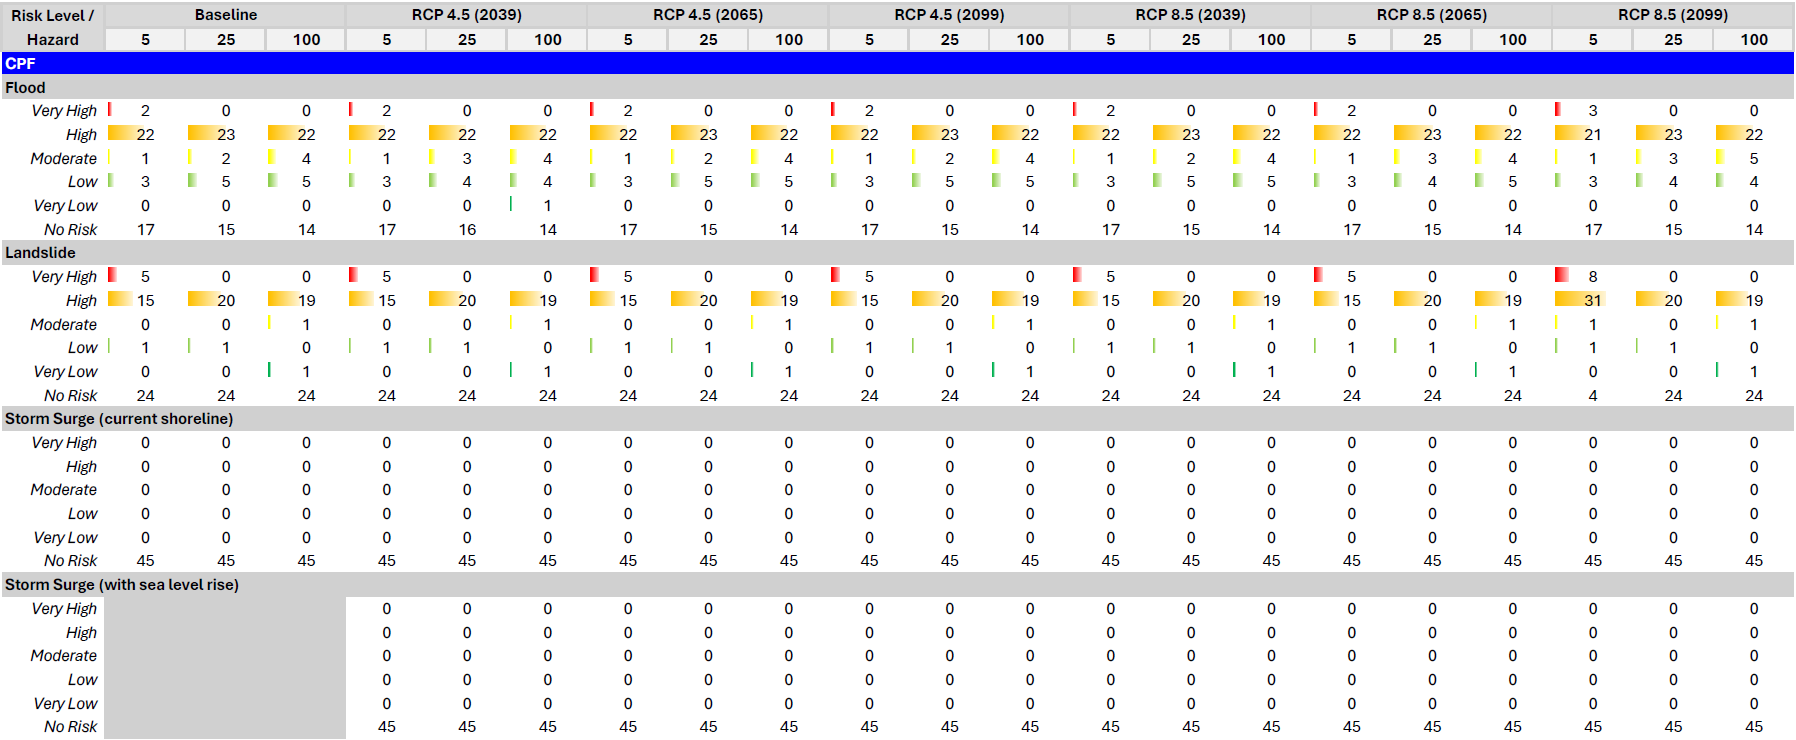
Figure 5. Summary of risk assessment results of the critical point facilities in the Municipality of Uyugan.
Map 4 shows the flood risk map of the population exposure unit in the Municipality of Uyugan.
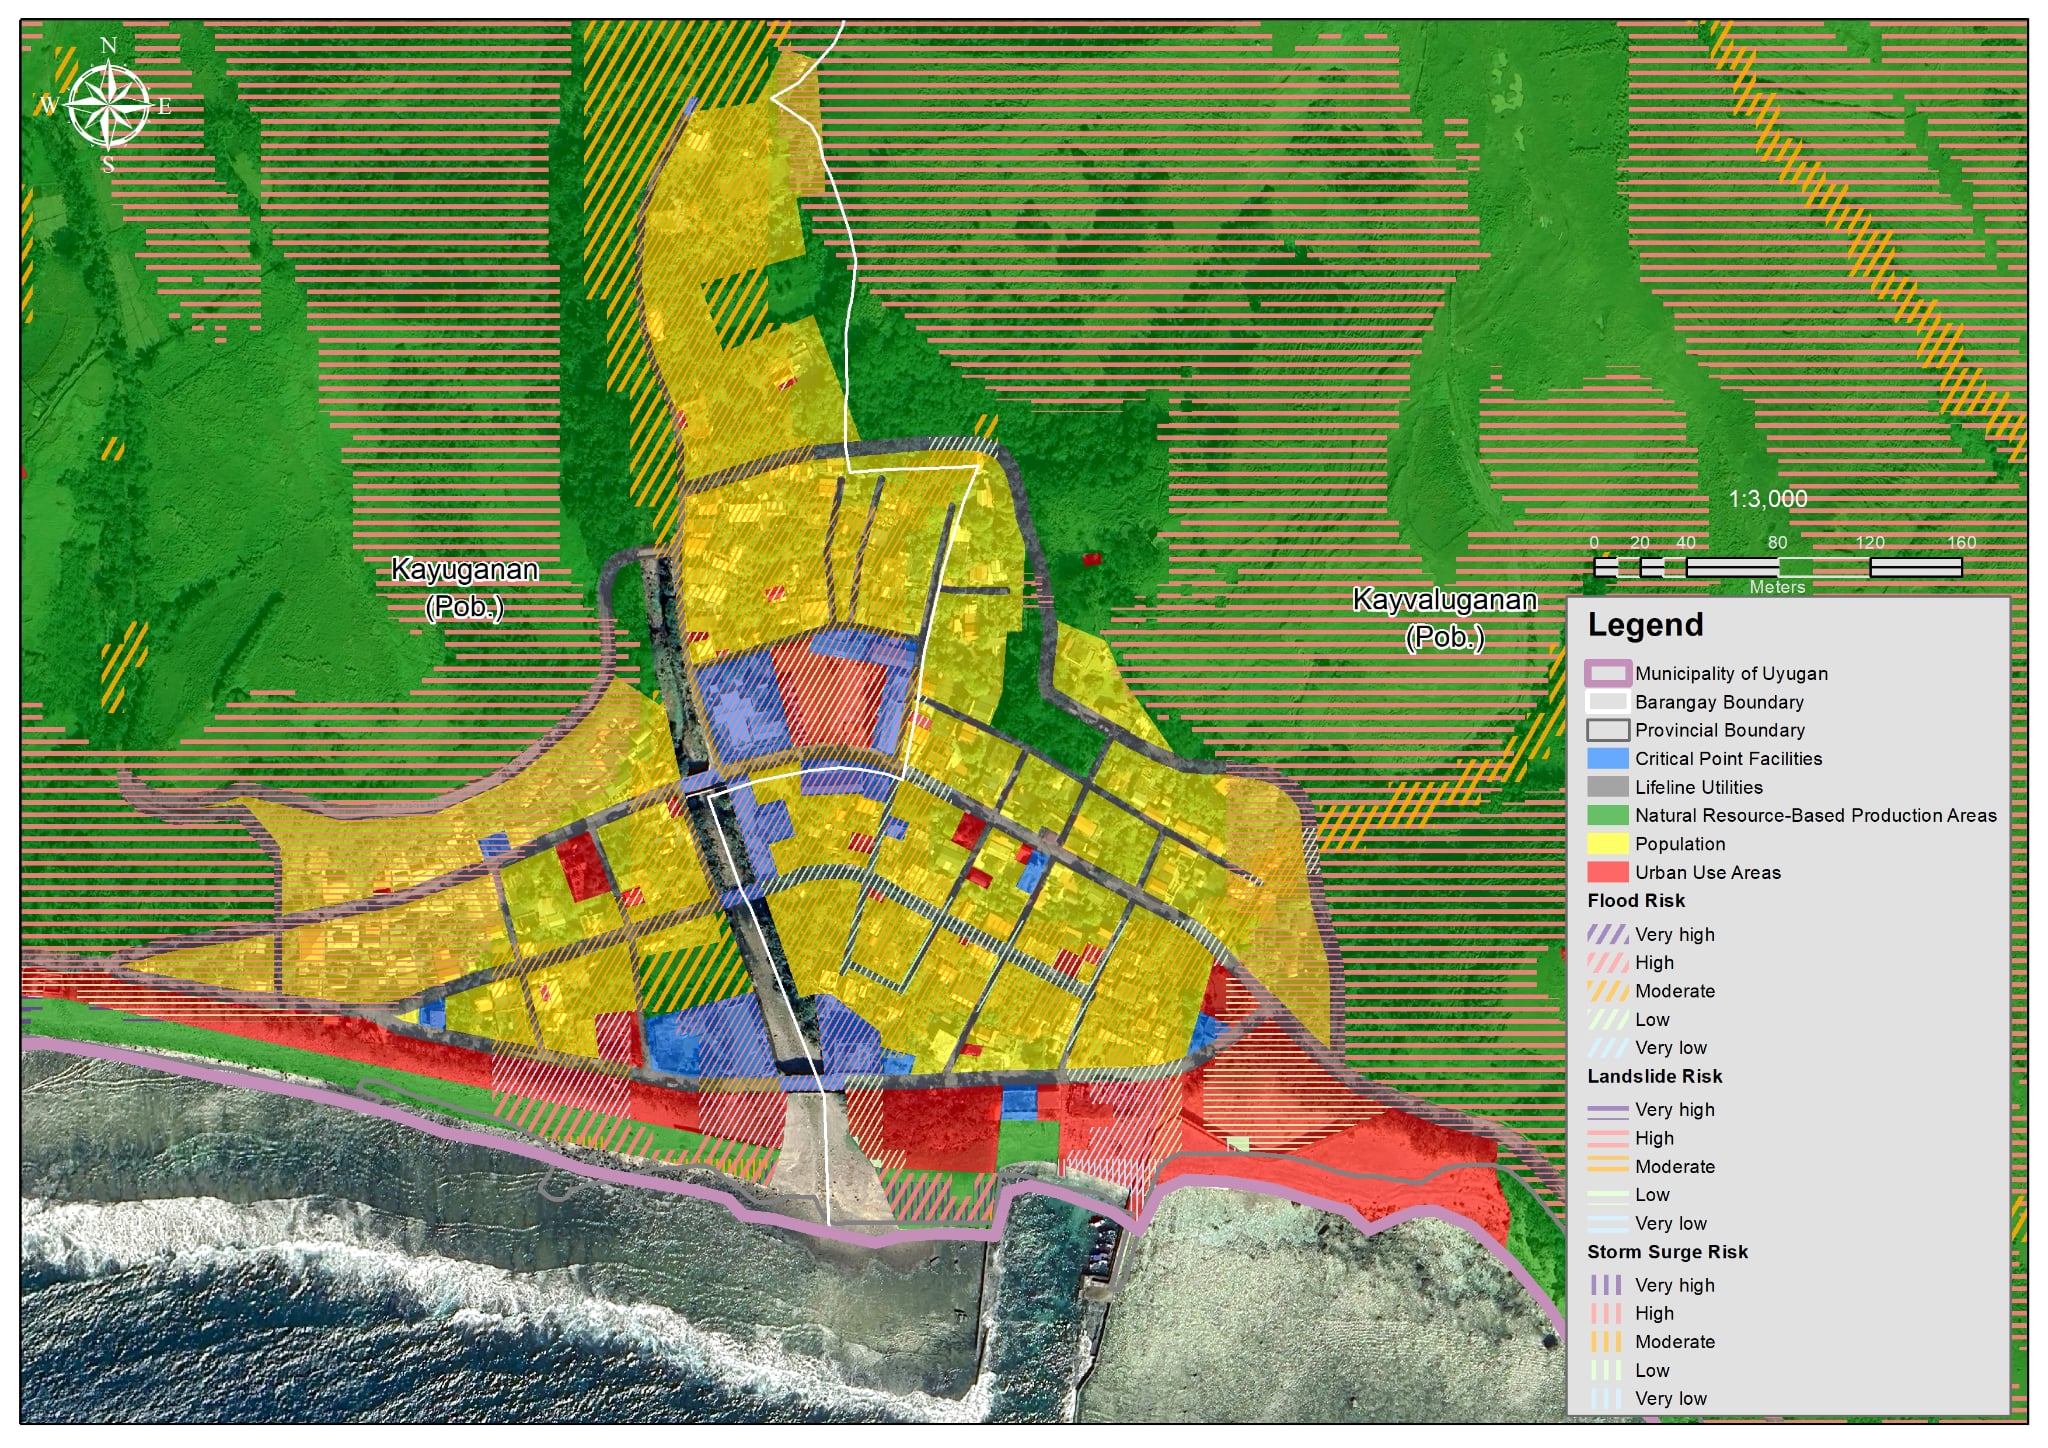
Map 4. Multi-hazard risk map of the población area in the Municipality of Uyugan, Batanes.
Municipality of Ivana
In Ivana, the assessment of LLUs center on the road network, given its critical role in maintaining connectivity and access to services across its four barangays. The results indicate low to high levels of risk across hazards, with some variation depending on hazard type and return period (Figure 6). Flood-related risks are distributed across low to high categories; however, the persistence of high-risk classifications among several road segments across scenarios indicates a heightened potential for disruption to critical transportation networks during intense flood events. Landslide risk is classified as very low to high, with half of the road segments in the municipality falling under moderate to high risk levels, indicating notable susceptibility to slope instability. In contrast, storm surge under current shoreline conditions remains very low to low, reflecting minimal present-day exposure of road networks to coastal inundation.
Across all scenarios with climate change projections, flood and landslide risks remain consistent in their distribution, indicating persistent exposure of road networks to these inland hazards over time. No significant shifts in risk levels of the exposed elements are observed, with road segments continuing to fall within low to high and very low to high risk levels for flood and landslide events, respectively. In contrast, risk to storm surge increases when sea level rise is considered, with several road segments transitioning from very low or low risk to low to moderate risk levels across all scenarios. This reflects a gradual increase in coastal exposure, particularly for segments located near the shoreline. Overall, the results show that inland hazards remain consistent, while coastal hazards become increasingly relevant under future scenarios, shaping the evolving risk profile of Ivana’s road network.
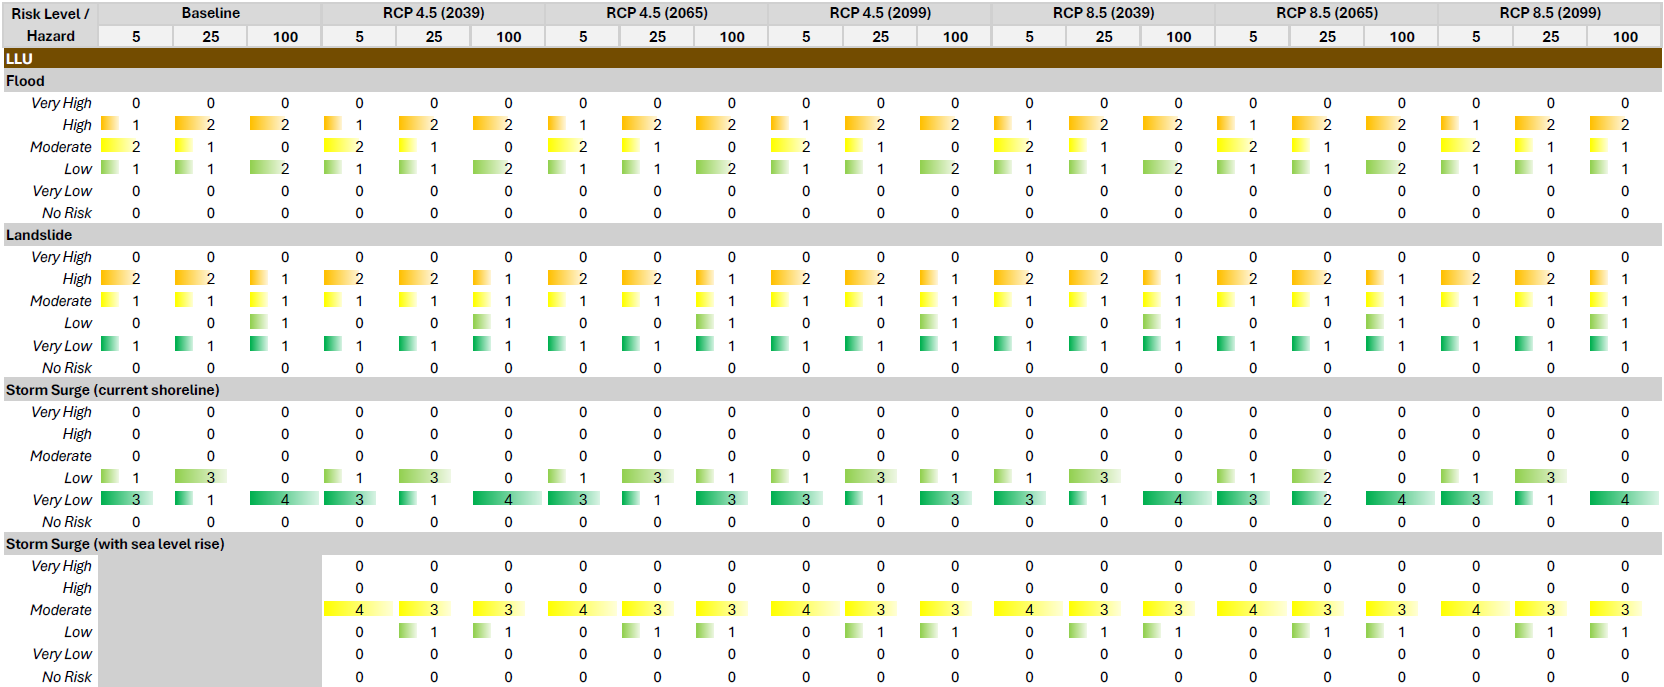
Figure 6. Risk assessment results for the lifeline utilities in the Municipality of Ivana.
Map 5 shows the flood risk map of the population exposure unit in the Municipality of Ivana.
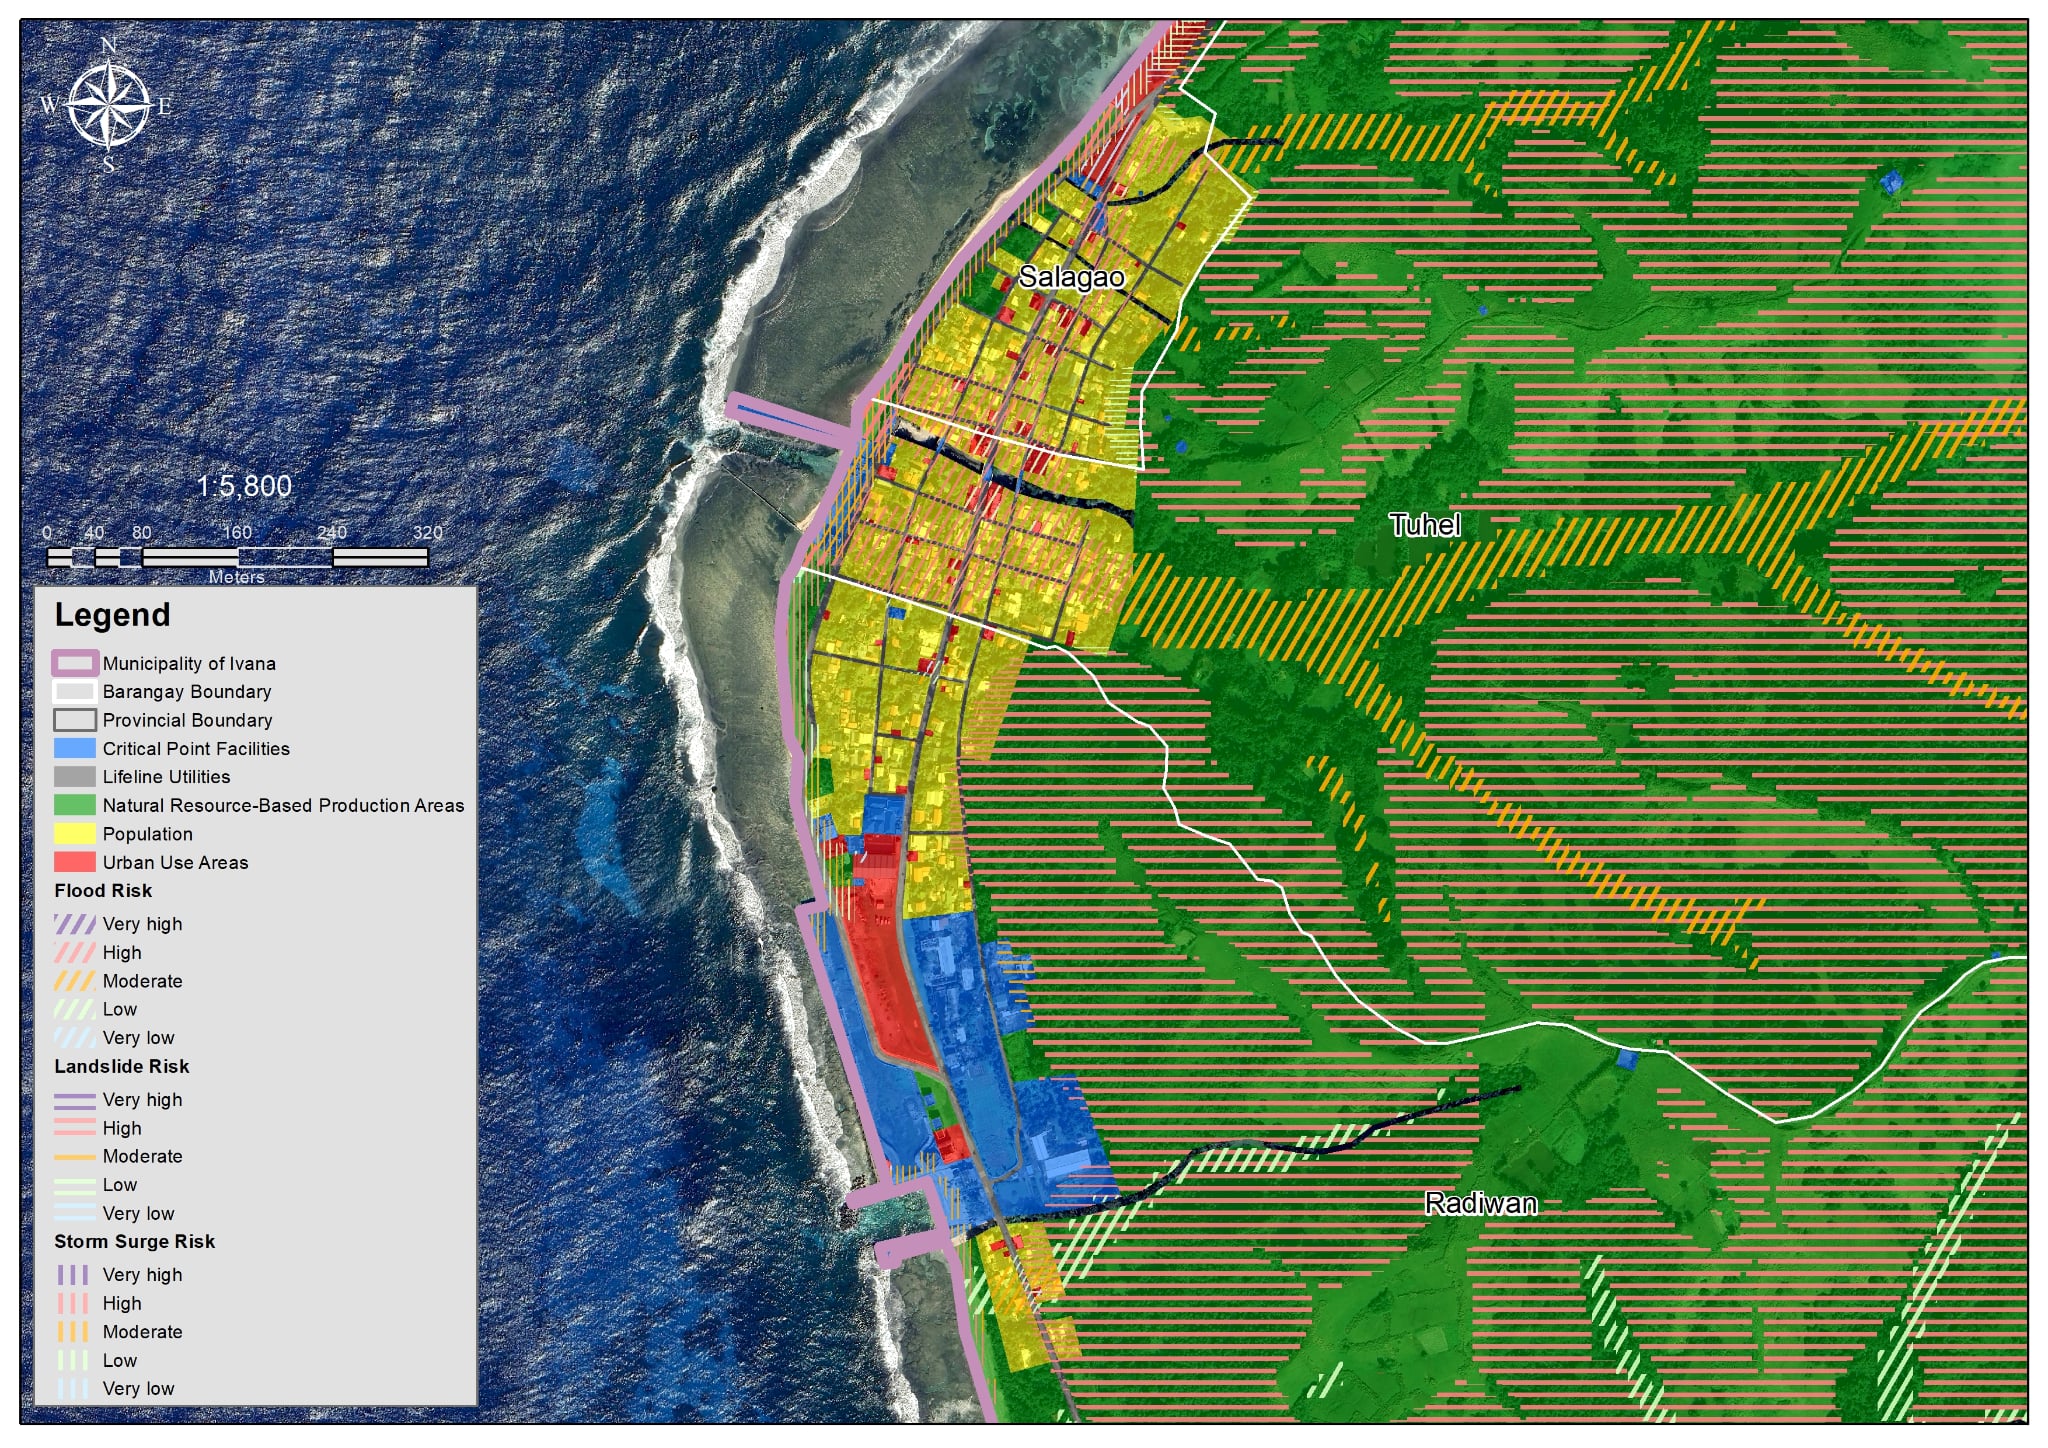
Map 5. Multi-hazard risk map of the población area in the Municipality of Ivana, Batanes.
Municipality of Sabtang
For the Municipality of Sabtang, the risk assessment of NRPAs, particularly agricultural, foreshore, aquaculture and forestry areas, show that these are affected by all hazards considered, indicating a broad and overlapping risk profile (Figure 7). Flood risk is predominantly distributed across the moderate to high categories, with most areas consistently falling under moderate risk and a notable number under high risk across all return periods and climate scenarios. Landslide risk, however, presents a more complex condition, with a large concentration of areas classified under very high risk, indicating widespread susceptibility of NRPA to slope instability. In contrast, storm surge risk under current shoreline conditions remains generally low, with most areas falling under low risk and only limited instances of moderate and high risk.
Across future climate scenarios, the patterns for flooding and landslides remain largely consistent, reflecting persistent exposure and underlying vulnerability of NRPA to these inland hazards. A notable shift is observed in storm surge risk when sea level rise is incorporated, where areas are redistributed across moderate, high, and very high risk categories across all timeframes. This indicates a significant increase in coastal exposure affecting production areas, particularly those located near the shoreline. Overall, the results highlight a multi-hazard risk environment, where NRPAs in Sabtang experience consistently high inland risks, especially from landslides, alongside increasing coastal risks under future conditions.
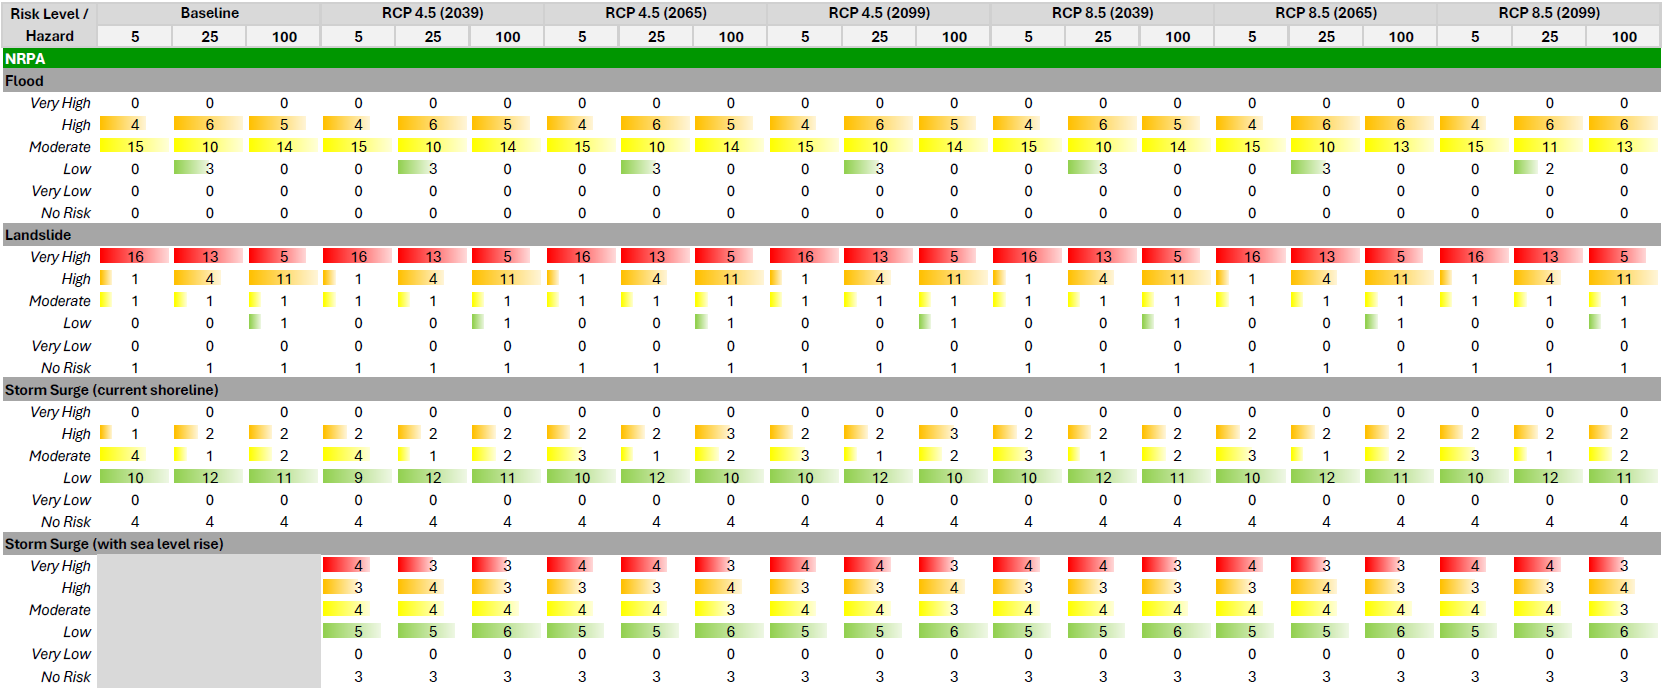
Figure 7. Risk assessment results for the lifeline utilities in the Municipality of Sabtang.
Map 6 shows the flood risk map of the population exposure unit in the Municipality of Sabtang.
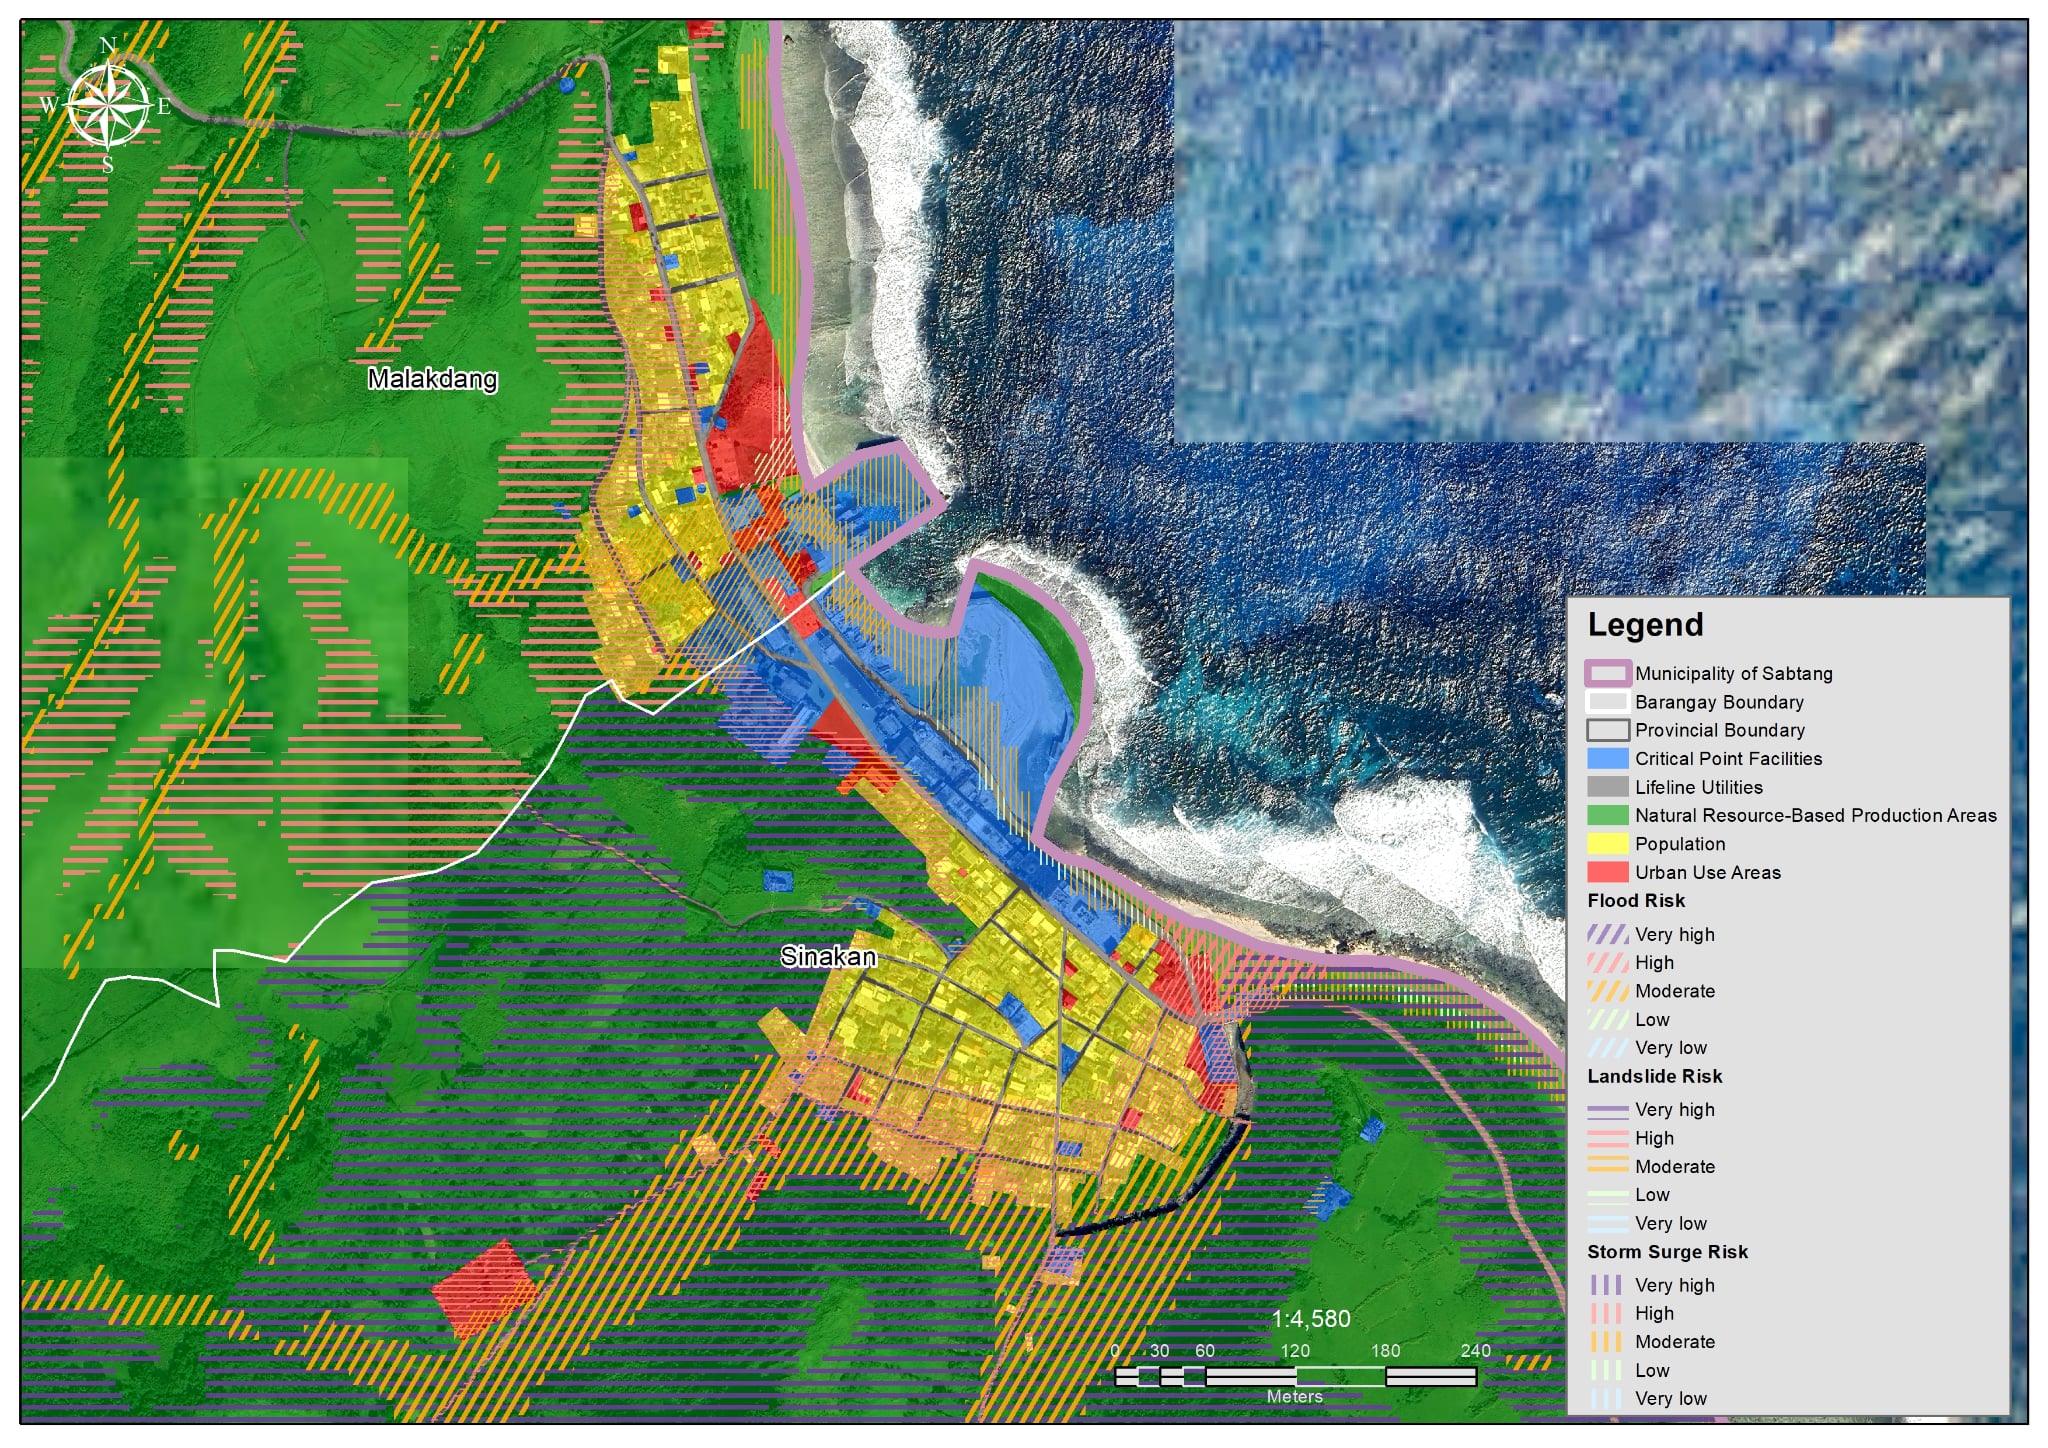
Map 6. Multi-hazard risk map of the población area in the Municipality of Sabtang, Batanes.
What Risk Assessment Results Mean for Local Planning
The results of the risk assessment provide a clearer understanding of how hazards, exposure, and vulnerability interact across different exposure units in Batanes. These findings highlight the need for risk-informed land use and zoning, where areas exposed to higher levels of risk from various hazards are carefully evaluated in terms of their suitability for development. Rather than applying uniform planning strategies, local governments can use these results to differentiate areas for protection, controlled use, or development, based on the level and type of risk present. This is particularly important in ensuring that future land use decisions do not further increase exposure in already high-risk areas.
At the same time, the results underscore the importance of protecting critical facilities and lifeline infrastructure, especially in municipalities where these are exposed to high levels of risk. Ensuring the functionality and continuity of services, such as transportation, emergency response, and basic utilities, is essential during and after hazard events. The identification of high-risk barangays and exposure units also allow LGUs to prioritize areas for targeted interventions, enabling more efficient allocation of resources and more focused risk reduction efforts.
These insights can be directly integrated into key local planning instruments, including the Comprehensive Land Use Plan (CLUP), Comprehensive Development Plan (CDP), and Local Climate Change Action Plan (LCCAP). By grounding these plans in risk assessment results, LGUs can move toward more science-based and proactive planning approaches. More importantly, the risk assessment serves as the foundation for the next step of the CDRA process—the identification of Risk-Sensitive Policy Interventions (RSPIs)—which translate these findings into concrete strategies, policies, and programs aimed at reducing risk and strengthening resilience in Batanes.
To complement the tabulated results and municipal summaries, multi-hazard risk maps were developed for each municipality to provide a spatial representation of risk distribution across Batanes. These maps integrate hazard, exposure, and vulnerability layers, enabling the identification of high-risk zones, critical assets, and priority intervention areas at a more detailed level. As visual tools, they support clearer interpretation of results and enhance their application in local planning and decision-making. The risk maps for all municipalities are presented below.